Analysts Have Been Very Bullish
Every year analysts are bullish. Heading into 2008, analysts expected the S&P 500 to go up when you use their bottom up target price estimate. It’s not a bad idea to expect stocks and earnings to move up each year since they usually go up. For sell side research, it’s better to be wrong about being bullish than wrong about being bearish. Investment banks needs investors to make a lot of trades and stay in the market to make money. The point I’m making is to take estimates with a grain of salt. I’m more concerned with the changes in earnings expectations than the original estimates because they always tell the same tale.
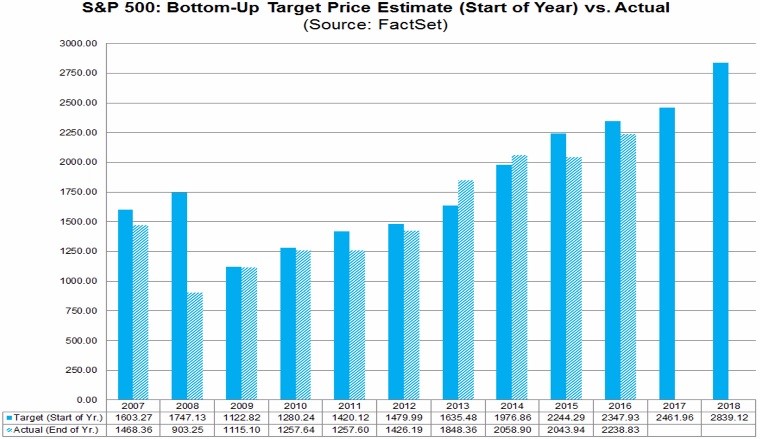
The chart below shows the earnings estimates at the start of the year compared to where they ended up. As you can see, in the past 10 years the actual results beat the start of the year estimates twice. The start of the year consensus EPS estimate for 2017 was $133.41. The current estimate is for $131.73. That is a 1.26% decline which is better than average. The average overestimate in the past 20 years has been 8.6%. 15 out of the past 20 years were overestimates. In theory, if the average were to continue for next year’s estimate, there would be an earnings decline in 2018. However, using the average would be wrong because recessionary years bring it down. Without those 3 years, the average overestimate is 3.7%. If you assume the current estimate for 2017 is reached and the 2018 earnings miss by 3.7%, the 2018 year over year earnings growth would be 6.8%. The main takeaway is it’s probable that earnings growth won’t be in the double digits next year. This doesn’t include the effects of the tax cut which could push earnings growth higher. 2018 would have been a tough year because of difficult comparisons, but the tax cut could alleviate that struggle.

The chart below compares the bottom up price target to the actual change in the S&P 500. This year, the analysts were too pessimistic as the market is up 17.8% while they expected a 9.97% gain. Next year, analysts are expecting about a 7.7% gain. Excluding 2002 and 2008, the average difference between the estimate and actual results is 3.1%, meaning the estimates were 3.1% too high. If that average continues, the S&P 500 would only go up 4.3%. This is in line with what I’m expecting. Since such precise predictions act as if the person has a crystal ball, I’ll say I’m expecting a 5% to 10% increase in the S&P 500 without looking at the tax cut. It’s tough to say how much the tax cut will help equities in 2018, since stocks have been rallying for a few weeks as the chances of it passing rise. In the next few weeks, we’ll look at more analysis to get a better idea how the corporate tax cut will affect earnings.
Leading Indicators Look Good
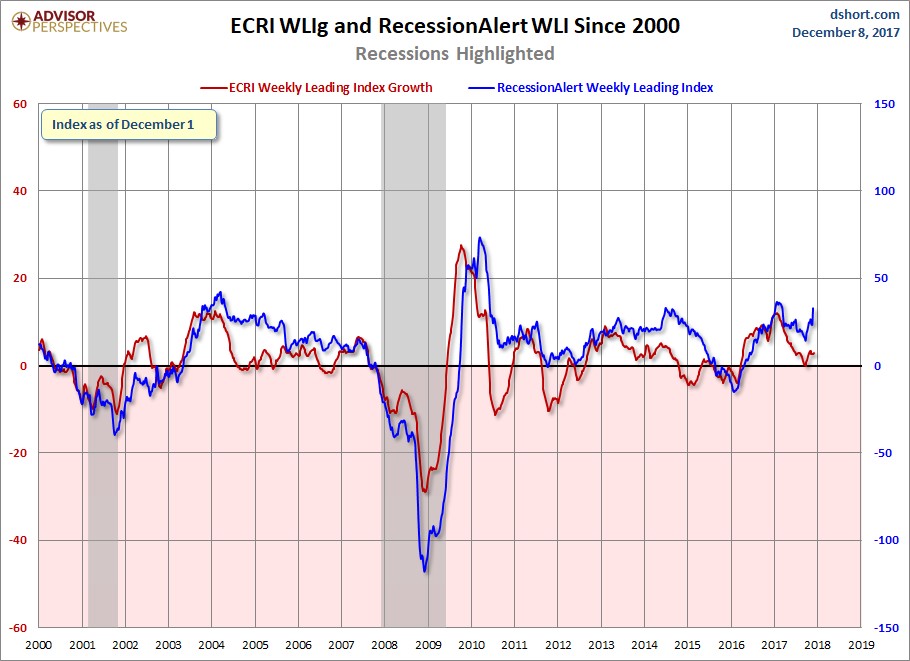
The current economic momentum looks great according to most metrics. I’ve previously discussed that the ECRI weekly leading index growth has been challenging. Because it didn’t fall to negative, I never was worried enough to claim a recession was coming in the next 12 months. As you can see from the red line, there has been a small rebound. The blue line shows that the Recession Alert metric isn’t signaling anything worrisome.
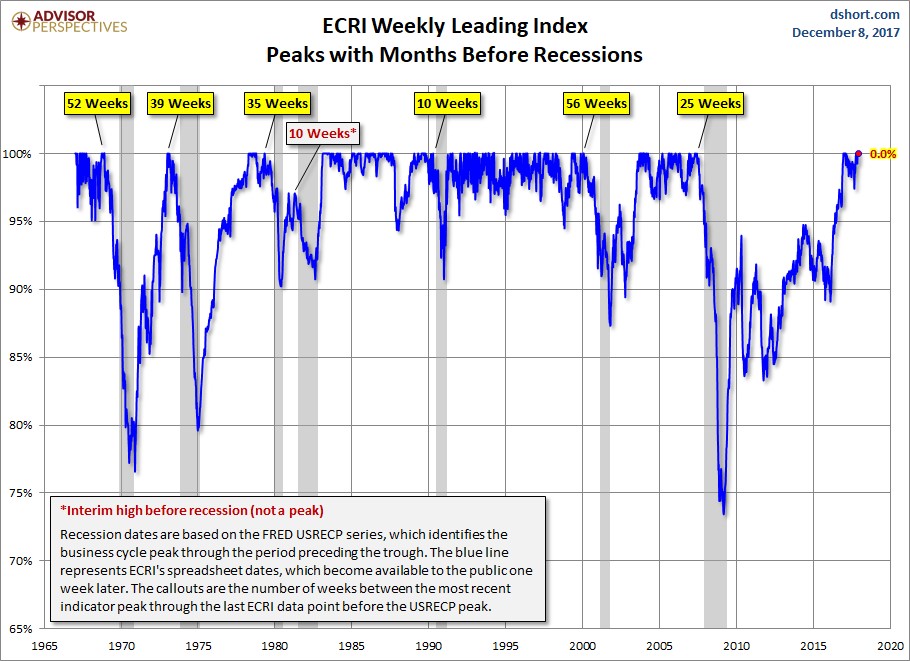
I have mentioned previously that economic growth estimates are usually based on previous results. The question is how long the economy will, at the least, stave off a recession when economic growth is solid. This is an interesting discussion because recessions can come relatively soon after economic results look great, meaning nothing can be assumed. Even if the data is great now, it doesn’t mean it will be good 6 months from now. The chart below gives us an idea how quickly growth can reverse. It shows the time between the ECRI weekly index peak and the next recession. As you can see, once a recession came 10 weeks after the peak. However, there have been countless other peaks which didn’t lead to anything. Ignoring recovery periods, usually anything more than a 10% decline means a recession is upcoming. We’re at the all-time high, so that’s not on the radar yet. There likely won’t be a recession in the first half of 2018.
Risks To 2018
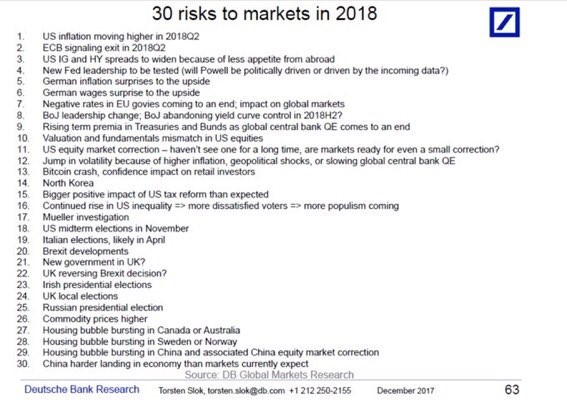
The list of 30 risks is too long for one article, so I’m looking at a few at a time. I have looked at the first 11 so far. Number 12 says there might be an increase in volatility because of inflation, geopolitical shocks, or the tapering of QE. This list seems to have repeats as inflation and tapering have already been mentioned. I think inflation will increase in 2018, but that doesn’t tell you much in terms of how stocks will do. The critical point is to figure out how much inflation is too much. While low inflation is great for stocks, slightly higher inflation isn’t bad either because it signals the economy is improving and wages are growing. Geopolitical shocks could happen every year. I see geopolitics through the lenses of the economy, meaning if emerging markets improve and commodities rise decently, but don’t spike, I expect there to be relative peace. QE coming to an end is widely expected by market participants. This makes me question how it would cause a shock.
The 13th risk is a bitcoin crash. I think this is a weird risk because bitcoin has crashed many times throughout its history without hurting the markets or the economy. It is bigger now than ever before, but it’s still not enough to catalyze a minor correction in stocks. The latest price is $16,700. The latest combined market cap of all the coins is $496 billion. The only way this is a risk is the huge amount of uncertainty the price has. Bitcoin could be at $30,000 or $300 by the end of next year. If it reaches $30,000, a crash would have a minor impact on stocks.
Recent Comments