2020 Will Go Down In Infamy
This is the worst market I’ve ever seen since I started following stocks in 2007. S&P 500 is only down 26.67% from its peak, but it’s clear we aren’t at the trough yet. This is already a historic period and it’s not over. Usually we can contextualize negative events by saying 2008 was worse. It’s possible this is worse than 2008 because it’s a human crisis becoming a financial crisis.
2008 was a financial crisis that became a human crisis. If the situation had gone wrong, possibly because of poor policy decisions, the entire financial system could have imploded in 2008. 2020 is way worse because if the situation isn’t handled correctly, we could see hundreds or thousands of Americans die. Most never thought a situation could have been worse than 2008, but here we are.
Frankly, if you said 6 months ago that a pandemic would cause a recession and shutdown the economy for a few months, I would have guessed stocks would have fallen 30% to 40%. The stock market has seen a massive panic, but it makes sense. If stocks were down 10%, it would be shocking.
Clearly, investors didn’t think COVID-19 would spread globally when they barely sold off stocks in January. Clearly, they didn’t do their research into the virus and didn’t see this pandemic coming.
1987 Part 2
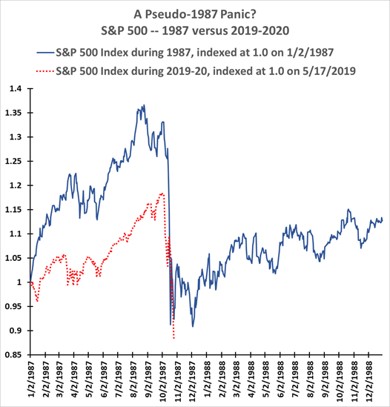
In the next 10 years, everyone will forget the 19% correction in 2018, but everyone will remember the 2020 COVID-19 crisis. This will be infamous even if the stock market is at the absolute bottom and we don’t see it fall 30%. I usually don’t like to show overlays of charts because they often predict huge declines based on circumstantial evidence. Now we have an actual crash to compared to 1987.
As you can see from the chart below, this crash is similar to the 1987 crash except stocks didn’t rise as much prior to it. Stocks rebounded after the 1987 crash, tested the lows, and then moved higher. Problem with this crash is COVID-19 doesn’t care about PE multiples or sentiment. Stocks can't rally on a sustainable basis. That is, unless the number of cases stops rising outside of China or we find a cure. A fiscal stimulus would help, but it likely won't be big enough and it’s not going to treat the actual issue.
Details Of Thursday’s Crash
Personally, I will remember March 12th, 2020 for the rest of my life. It was that big of a deal. As you can see from the table below, the S&P 500 fell 9.51% which was its 5th worst decline since 1926. The March 9th crash was the 20th biggest. Only in 1929 and on October 19th, 1987 did the S&P 500 fall more in one day. The market can’t fall more than 20% in a day again because of limits.
The market would shut down at that point. Thursday could be the worst day of this bear market. But it probably won’t mark the low. And it definitely won’t be the end of the human suffering created by COVID-19.
Unfortunately, the Italian healthcare system is overrun with patients; it is about 2-3 weeks ahead of America which means more pain is coming in April. We could see a complete and total shutdown of the U.S. economy in April.

Only 1% of stocks in the S&P 500 are above their 50 day moving averages which is the lowest since August 2011. Less than 6% of S&P 500 stocks are above their 200 day moving averages which is the lowest since March 2009. Only one stock rose on Thursday which was the lowest since November 2011. It was Occidental Petroleum which has gotten hammered in the past few weeks.
Dow is down 15.3% in the past 2 days. Only 5 two day periods were worse in the past 124 years. In 4 of those 5 situations stocks rose with an average gain of 5.2%. This is the fastest S&P 500 bear market since 1933 when the market fell 20.9% in 3 days.
As you can see from the chart below, 72% of stocks on the NYSE have fallen to a 52 week low. Going back to 1965, the only other time more than 70% hit a yearly low was October 10th, 2008.

All Sectors Implode
Nasdaq fell 9.43% and the Russell 2000 fell 11.18%. VIX was up 21.57 points to 75.47. Last time the VIX was at 50 or above was in 2008. As you can see from the chart below, the Biotech ETF XBI is down 17% in the past 2 days. That’s its largest 2 day decline ever. As you can see, the ETF was started in 2006, so that includes the financial crisis.

CRB commodity index closed at its lowest level since February 1972 as it is down 70% from its 2008 high. The S&P 500 energy sector is down over 35% in the past 5 days which is its largest decline ever. This is the XLE’s lowest close since March 9th, 2009 (including dividends).
S&P 500 is down 23.22% year to date. You can throw out my prediction for a 7% gain. CNN fear and greed index is at 2 which is the lowest in a long time. The market is down 16.5% just this week. That would be the 4th worst QUARTER for the index in the past 40 years.
Every sector fell hard. Worst hit were the utilities, financials, industrials, and energy. They fell 10.2%, 10.77%, 10.33%, and 12.3%. Exxon Mobile stock was down 11.43%. It’s down 47.56% year to date.
JPM Morgan stock was down 8.23% and is down 37.59% year to date. It has a 4.09% dividend yield which I think is safe. Exxon’s 9.36% dividend is not safe. EOG Resources stock fell 16.47% and is down 61.37% year to date.
1 Comment
Kevin Morgan
March 13, 2020Excellent realistic view. Your statement about the US economy potentially "shutting down in April" is very confirming for me. Watch coronavirus.app data. It is CLEARLY showing world wide daily infection growth that is EXPONENTIAL. I will continue trade to the short side after the corrective rallies upward. It's a fantastic trader's market. We play the cards the market and the world deals us...