Junk Bonds’ Recent Trading
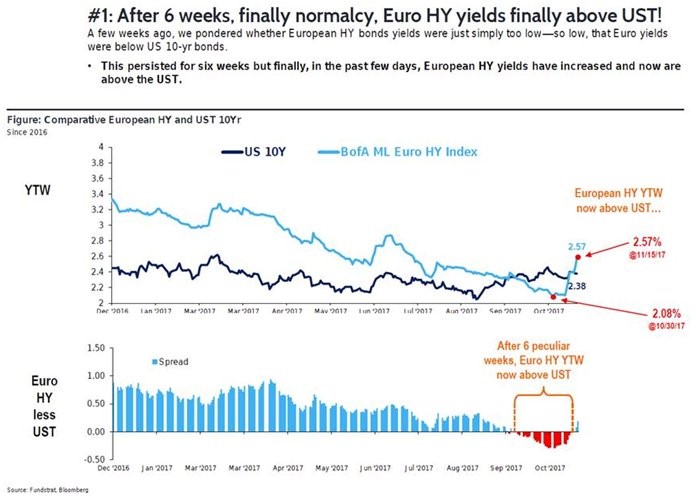
On Friday, the small caps outperformed the mega caps as the Russell 2000 - RUT was up 0.40%, while the Dow was down 0.43%. In the midst of this middling action, the JNK high yield bond index was down 0.05% and the HYG high yield bond index was down 0.03%. The chart below shows the recent action in the European high yield bond index. It has been selling off more sharply than American junk bonds in the past few weeks. As you can see, the 6 week stretch where the European high yield bonds had lower yields than U.S. treasuries has ended with a spike in European junk bond yields. Obviously, that was a weird stretch because U.S. treasuries have a AA+ rating from S&P500 and a AAA rating from Fitch while European junk debt consists of highly risky corporate bonds.
I speculate that the ECB’s policy of buying corporate bonds has pushed European junk bond yields lower than the free market would price them. These low yields allow companies that would probably go out of business to stay in business. These firms are known as zombies. They have the most prevalence in Italy where about 20% of firms are zombies. The ECB pulling back its purchases in 2018 might have catalyzed this selloff. If that’s the case, this selloff is only just getting started because the ECB will end the program at the end of 2018.
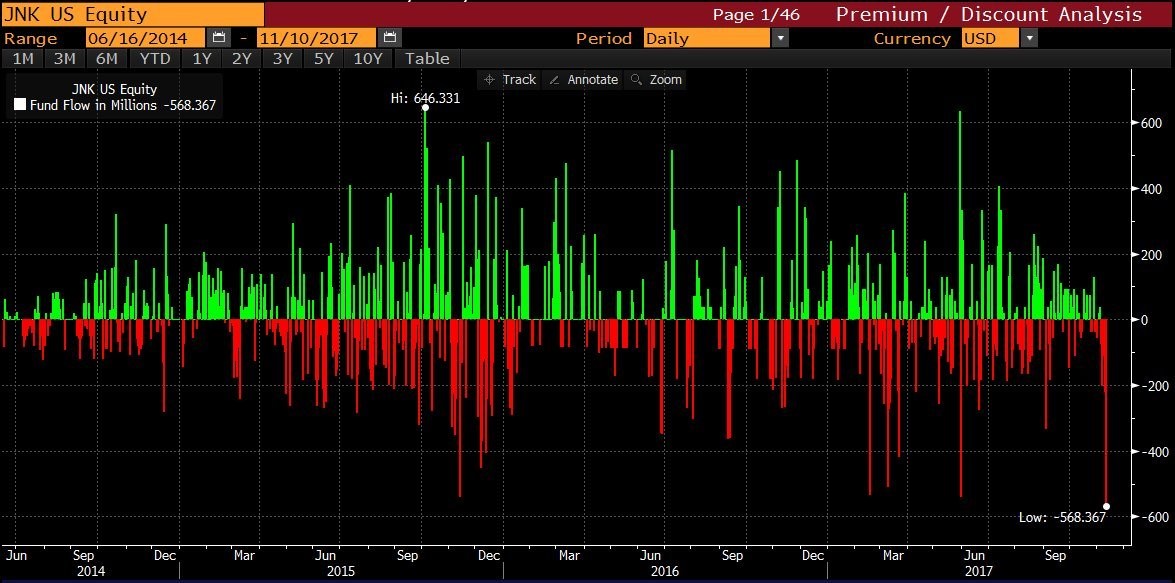
Getting back to American high yield bonds, the JNK ETF had one of the largest single day outflows, but the HYG didn’t have a similar sized selloff that day. The chart below shows the severity of the JNK outflows. As you can see, this was the largest outflow in at least the past few years. It was a weird outflow because it didn’t lead to much of a decline in the JNK probably because it was short lived.
While the HYG didn’t have big outflows in that one day of trading where the JNK had massive outflows, the HYG did have a big week of outflows. As you can see from the chart below, the high yield ETFs and mutual funds had a combined $4.43 billion in outflows. These were the largest outflows in the past 3 years and 2 months. This was the 3rd largest week of outflows ever. The second largest was in August 2014. The HYG ETF had $1.43 billion in outflows from last month and the JNK had $934 million in outflows.

The chart below shows a technical analysis of the JNK. As you can see from the red line below, there was a mean reversion as the 1 week average price fell below the 13 week average. As you can see from the table in the lower left corner, whenever this mean reversion occurs, the average annualized gain in the index is 46.71%. The second table shows that the JNK is up in the next week, 2 weeks, and 12 weeks when this mean reversion occurs. This rally has already started as the index was up 0.93% on Thursday. The fact that so many investors were hyper-focused on this selloff gives sentiment confirmation that the selloff went too far and a snap back rally was in order.

Sector Weighting- Telecom Is Tiny
In a previous article, I discussed that the telecom sector was driving much of the selloff in junk bonds. Then I said, it didn’t make sense to think this junk bond selloff would lead to a correction in the S&P 500 because the telecom sector makes up a much larger portion of the JNK than it makes up of the S&P 500. Only 3 telecom stocks are in the S&P 500, namely Verizon, AT&T, and CenturyLink. The chart below shows the percentage share the telecom sector makes up of the S&P 500. As you can see, the percentage has fallen below 2.5% which is a quarter of where it was at in 1990. This shows how inconsequential the selloff in telecom junk bonds was to the S&P 500.

If you’re curious about the balance of power between sectors, the chart below shows that there is less balance now than there was in the 1990s. The S&P 500 probably would have added the combination of T-Mobile and Sprint if they would have merged. Even without the merger, I still think T-Mobile should be in the S&P 500 since it has almost a $50 billion market cap. This is the type of decision that passive investors don’t take into account when they buy the S&P 500. Who is to say that 3 telecom companies deserve to be in the S&P 500? When you buy the S&P 500, you aren’t buying all of corporate America; you are buying the companies that meet the metrics provided to get into the index. The bigger passive investing gets, the more important trades that game the system by buying stocks that will probably get into the index will be. It’s always a good trading opportunity if you spot it, but with more money being sucked up by passive S&P 500 index funds, there will be more opportunities to buy undervalued firms outside of the index.

The makeup of the S&P 500 is critical for measuring bottom up earnings. Because technology and energy were the drivers of profit growth in 2017, any change in the sector weighting would have a big impact on the results if it affected those two sectors.
Conclusion
It’s great to get an idea of where the junk bond market is going. I am of the belief that bonds are better at forecasting the economy than stocks because retail money isn’t involved in the debt market. Just looking at a couple indexes isn’t good enough when evaluating what junk bonds are signaling. Looking at which debt is doing poorly helps you figure out what the signal means. Secondly, the signal needs to be bigger than a few percentage points. This was a quite year, so a ripple makes the headlines. However, a ripple in junk bonds cannot catalyze a correction in stocks.
Recent Comments