When evaluating a company fundamentally, there are three styles of fundamental investing: growth, value and income. The concept of value investing is that you are buying a company at a discount to what you feel the company is worth.
You can make other considerations to determine the strength of a company. But there are specific criteria that can help define whether a company is a value or not. This article is an introduction on how to analyze the value prospects of a company and some of the key metrics to use in the process.
Value Investing - Approaches to Value Investing
As a retail investor, you can typically use two styles of fundamental analysis to determine valuation. The first method involves a Discounted Cash Flow (DCF) analysis to determine the company's intrinsic value.
The second method utilizes a Comparable Company Analysis. Comparable company analysis uses trading multiples like price-to-earnings or price-to-book to compare companies' relative value. Using a DCF model is a bit complex and requires spreadsheets or other tools for calculating intrinsic value. Since this is an introduction to value investing, our focus will be on comparable company analysis.
When doing a comparable company analysis, some factors are relatively industry specific. One approach involves finding the best relative value in a particular industry, called Top Down Analysis. Another approach finds the companies that meet a rigid set of criteria called Bottom Up Analysis. You can use both methodologies to evaluate companies. And it will depend on whether you intend to invest in a specific industry or sector.
Value Investing - EBIT vs. EBITDA vs. Net Income
Many valuation measures use some form or earnings to evaluate the potential value in a company. When looking at various multiples, different types of earnings are used and is therefore essential to understand the differences. Let's review the differences between EBIT, EBITDA and Net Income.
Value Investing - Earnings Before Interest Taxes, Depreciation and Amortization (EBITDA)
EBITDA adds back expenses for interest, taxes, depreciation and amortization. EBITDA is a good measure for financial performance and profitability but can be a little misleading in that it strips out the interest cost of capital investments like property, plant and equipment. Some companies might accelerate their depreciation to lower the income to pay fewer taxes. Utilizing EBITDA takes out some of the impacts of these tax-saving decisions but does so at the expense of any consideration for the level of debt service.
Value Investing - Earnings Before Interest and Taxes (EBIT)
Another name for EBIT is operating profit. It accounts for the profits earned on capital before paying interest and taxes.
Value Investing - Net Income
Utilizes accrual accounting and represents the bottom line of the income statement and includes all sources of income and subtracting all expenses. Accrual accounting is a methodology that accounts for revenue and expenses as they occur as opposed to when the cash changes hands.
Value Investing - Enterprise Value vs. Book Value vs. Market Value
Another common approach to valuation is to determine how much return the company is generating compared to the company's value. Some methods use market prices when determining valuation, and others use the company's financial statements.
To better understand valuation multiples, it's important to understand the distinction between Enterprise Value, Book Value and Market Value.
Value Investing - Enterprise Value (EV)
This approach represents the takeover value of a company. If another company buys a company, that company must pay the market value of the equity plus the market value of the debt of the company.
You can use any cash or cash equivalents the company has to offset some of those costs. Thus, the formula for EV below.

Value Investing - Book Value
The actual net asset value of the company that you show on the "books." You reflect it through the financial statements. It represents the value if you sell all of the assets and repay all debt at their recorded value on the balance sheet.
It is the amount that equity holders expect to receive if a company decides to liquidate. Assets included in the calculation are cash, investments and advances, inventory, PP&E, accounts receivable, and intangible assets like goodwill.

Value Investing - Market Value
This represents the market capitalization of the company. This involves taking the price per share and then times it by the number of shares outstanding.

There are advantages and disadvantages to each metric, and so a comprehensive picture of valuation would likely include all of them as a metric.
Value Investing - Valuation Multiples
Now that we've discussed the terminology used in valuing a company, we're prepared to discuss valuation multiples. In the case of valuation, the lower the multiple, the better. This is very different from other metrics that reflect earnings and management effectiveness.
The great thing about the different styles of investing is that they don't have to be isolated. It is always good to see strong growth and an effective management team that is generating a return for investors.
A profitable company paired with a compelling valuation only makes the investment opportunity more compelling. A company that appears to be a good value with negative earnings and poor management may just be a value trap.
Value Investing - Price-to-Earnings (P/E)
This is a ratio comparing the company's share price to its earnings per share (EPS). This ratio is often called a price multiple or earnings multiple. P/E is one of the more difficult measures to use when determining valuation.
The reason is that a growth-oriented company may reasonably trade at a higher multiple than a lower growth company. When using P/E, you can compare it against its 5-year mean or a similar company in its industry.
There is a cautionary note when the P/E is too low (less than 6), in that the market may be indicating that the current earnings may not be sustainable.

Value Investing - Price/Earnings-to-Growth (PEG)
This measure normalizes the P/E by incorporating the projected earnings growth rate of the company by analysts. Thus, a higher P/E isn't a problem as long as it is justified by high expected earnings growth in the future.
A standard measure for earnings growth is the 5-year growth estimate. Many websites like Yahoo Finance provide this information for free. The PEG ratio is calculated by dividing the P/E ratio by the 5-year projected earnings growth rate.

Value Investing - Price-to-Book (P/B)
This ratio is calculated by dividing the price per share by the book value per share. P/B is more stable than P/E since it's not affected by negative corporate earnings.
When a company's assets are marked to market it makes P/B particularly helpful. One of the disadvantages of P/B is that it doesn't capture the value of intangible assets such as a corporate brand.

Value Investing - Price-to-Sales (P/S)
This is a ratio that compares a company’s revenue per share to the price of the stock. This approach is valuable when comparing companies that have little or no earnings.

Value Investing - Enterprise-Value-to-EBITDA (EV/EBITDA)
This valuation multiple is similar to P/E except that it uses EBITDA and the enterprise value of the company. This is an indication of the amount of cash flow the company is generating in relationship to the takeover value of the company.
Thus, instead of focusing on bottom-line earnings, it's more of a cash flow measure. Like P/E, the typical value range does change depending on the industry, but unlike P/E, most companies can have a defined value range applied to them.

Value Investing - Earnings Yield (Greenblatt)
The typical calculation for earnings yield is just the inverse of the P/E ratio. Instead, this measure uses a company's EBIT and enterprise value.
Joel Greenblatt's popularized this approach as part of his "Magic Formula." By using this approach, this allows you to put companies with different levels of debt and different tax rates on similar footing.

Value Investing - Searching Criteria for Value Candidates
If you're applying a top down or a bottom up method, it will change how you use these valuation multiples. As was mentioned at the beginning of this article, the use of specific values for these multiples will depend on your approach.
For top down analysis, specific multiples aren't necessarily being targeted. You'll find it difficult at times to find stocks within specific industries to meet a set of criteria.
For example, valuations for utility companies are consistently higher than in other sectors. However, you can find the stocks in a particular industry or sector of interest that have the lowest combination of values for these criteria.
Thus, finding the best value candidate in that sector or industry.
When conducting a bottom up analysis, you're explicitly targeting stocks that meet a set of criteria. Here is a list of criteria that can be used to identify value candidates.
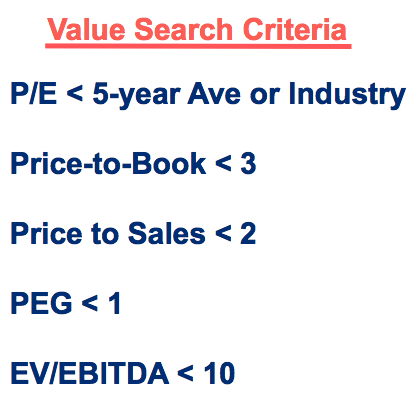
The following link (http://tos.mx/78sZaa) is to a TOS watchlist that has the results from a search using these criteria and some additional filters. The other filters incorporated market cap of over $500M, excluded OTC stocks, REITs and MLPs, and trades over $2M in daily trade value.
The attached Excel spreadsheet also contains the symbols along with the values for all of the criteria in the search.
The spreadsheet also includes the values for Earnings Yield. Earnings Yield can be a way of prioritizing the search results. Stocks that meet these criteria with the highest yield would be the top candidates.
Value Investing - Example
Micron Technology Inc (MU)
Market Cap: $43.3B
P/B Ratio: 1.29
P/S Ratio: 1.57
EV/EBITDA: 2.24
PEG: 0.13
Earnings Yield: 32.41%
MU is trading at a significant discount and at its current rate of earnings appears to be an extraordinary value. The big question is whether or not this is a great value opportunity or potentially a value trap.
One area of analysis that can be helpful to make that determination is analyst estimates. Currently, MU is expected to see an 18% decline in its current fiscal revenue year-over-year and a 39% decline in earnings.
Despite the lowered forecast, analysts are still projecting positive earnings, and it is trading nearly 40% below its 52-week high. Its earnings report on March 17 received a strong positive reaction on significant volume.
The price has since fallen back below pre-earnings levels on declining volume. In March, eight analysts have upgraded the stock to either a buy or strong buy recommendation.
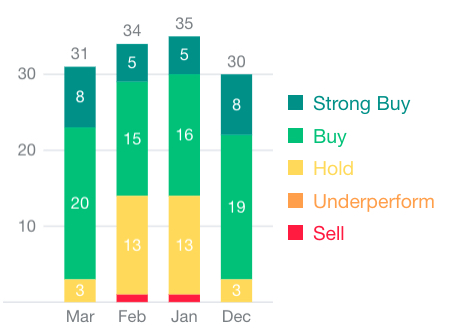
Source: Finance.Yahoo.com
The reaction to the earnings and analyst upgrades for MU is significant. The failure to hold the gap level following the earnings is a little disappointing, but as the price falls, it does allow for a lower risk entry.
MU has generated significantly higher earnings growth the past year, and the downgraded expected earnings brings metrics like Return on Equity closer to its 5-year average levels.
Given the earnings uncertainty, there are likely better candidates right now on the watchlist. However, the recent analyst upgrades and move on the earnings may be an early sign that the stock may have bottomed.
A continuation above the $44 resistance or further analyst upgrades may provide the timing for entry for this type of trade.

Value Investing - Trading Value Stocks
There are many different approaches to trading value stocks. Applying fundamental analysis principles is a means of providing a reason for the expected price movement and a potential target price based on historical or projected valuations.
The difficulty in trading fundamental information is understanding the timeframe for the move happening and managing risk.
The position could be held until the target is reached, but how much will the stock be allowed to move adversely before being closed. Many fundamental traders will consider a drop in the stock an opportunity to add more shares.
This approach is called Dollar Cost Averaging (DCA). DCA does test the resolve for many self-directed investors and does open up the possibility for significant losses if not managed appropriately.
Technical analysis can provide a significant benefit when trading fundamental analysis. It provides a rules-based approach for trading the projected move and an ability to apply risk management techniques.
Identifying technical strength, coupled with fundamental support for picking the stock is a combination that can be a potent combination.
Value Investing - Conclusion
There is an eternal debate among stock investors of whether investing for Growth or Value is a better approach. The growth investors have performed significantly better over more extended periods in the past 20 years, but periodically value does outperform.
That dynamic isn't necessarily going to continue forever and understanding these principles can provide insights into opportunities that offer a blend of growth and value, or income and value.
By applying a fusion analysis approach of incorporating both fundamental and technical analysis, you may fund that it provides a systematic approach to trading these types of stocks.
Recent Comments