Energy Boosts Headline Inflation
January CPI report was more of the same type of reading we have been seeing this cycle. Inflation stayed low which means the Fed will keep rates low. Those who don’t follow this report closely will be surprised by the jump in energy inflation since oil prices cratered in January because of the coronavirus.
It was all about the easy comp. If oil prices stay this low, energy inflation will stop boosting headline inflation in the spring. In the meantime, real wage growth calculations will plummet as the deflator rises. This factor hasn’t seemed to have hurt the consumer yet as consumer confidence was high in January.
Specifically, headline CPI was 0.1% which missed estimates and the last reading which were both 0.2%. While monthly CPI fell, yearly CPI was up from 2.3% to 2.5% which beat estimates for 2.4%. Yearly inflation was driven by energy prices because of its easy comp. If oil prices hadn’t cratered because of the coronavirus, headline inflation would have had a big spike.
Energy inflation increased from 3.4% to 6.2%. Its comp went from -0.3% to -4.8% which means its 2 year stack fell from 3.1% to 1.4%. Energy inflation will be strong in February as well since its comp is -5%. In the spring, the comp gets harder, but then in the late summer and fall, it gets easy again.
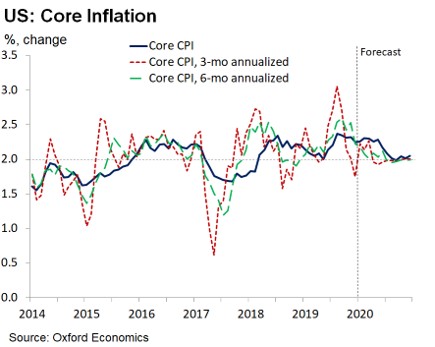
Monthly core CPI was 0.2% which met estimates and was up from 0.1%. Yearly core inflation rose slightly, but stayed at 2.3% which beat estimates for 2.2%. The chart below shows Oxford Economics’ forecast for core CPI. It expects it to fall back to 2% in 2021. Core CPI is above the Fed’s 2% target, but core PCE inflation isn’t. In January, headline PCE inflation is expected to increase 0.2% to 1.8% and core PCE inflation is expected to rise 0.1% to 1.7%.
Core PCE inflation is still below the Fed’s target which encourages it to cut rates. Let’s look at the details of the headline and core number. Headline CPI rose 19 basis points to 2.48% because of energy inflation. Its comp was 44 basis points easier, so its 2 year growth stack fell like energy. Core CPI rose 2 basis points to 2.27% while the comp was 6 basis points easier.
corecpi CHART
Details Of January CPI
Again, energy had high inflation. Energy commodities inflation was 12.1% as fuel oil inflation was 6.5% and gas inflation was 12.8%. Food inflation was 1.8%, so it slightly suppressed headline inflation. As usual, food inflation was mostly in the food away from home category.
Labor market is tight and food away from home is labor intensive. Waiters tend to be paid low wages which is the exact category with the highest wage growth. Specifically, food at home inflation was 0.7% and food away from home inflation was 3.1%.
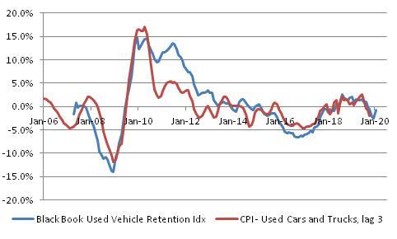
While energy inflation didn’t follow the change in prices because of the weak comp. Core commodities inflation did as it was -0.3%. Core commodities inflation didn’t have a very easy comp so it was negative. It was driven lower by used car and trucks inflation which was -2%. Based on the Black Book used vehicle retention index, used vehicle inflation will increase modestly in the next 3 months as you can see from the chart below.
New vehicle inflation was just 0.1%. Medical care commodities inflation was 1.7% which is less than medical care services inflation. This fell from 2.5% as pharma inflation fell from 2.5% to 1.8%. As usual, tobacco and smoking products had high inflation as it was 5.4%. This is how tobacco firms grow profits despite the decline in volumes.
Core services inflation upticked to 3.1% as it was driven by medical care services inflation again. Medical services inflation stayed at its joint cycle high of 5.1%. It has been stagnant for 3 straight months. This omp was 0.2% easier, so the 2 year stack fell slightly.
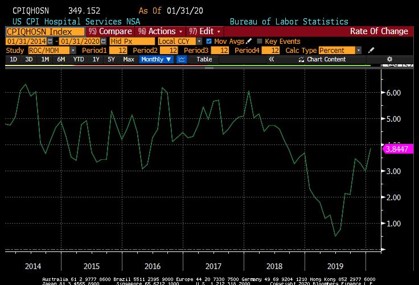
As you can see from the chart below, hospital services inflation rose to 3.8%. It was 75 basis points on a monthly basis. Doctor services inflation was -38 basis points monthly. Transportation services inflation was low again as it was 0.7%.
Now let’s look at the biggest component of this report which is shelter. Shelter inflation increased from 3.2% to 3.3%. It has been in a tight range for the past few yeas as it has steadily been above core inflation. It has been above core inflation since September 2012. Since July 2015 it has a low of 3.1% and a high of 3.6%. It has hardly moved in the past few years. Even as there have been sharp movements in the Case Shiller’s yearly growth rate.
CPI measures shelter costs using only rents. Lodging away from home had 0.18% monthly inflation which was up from -1.37%. Owners’ equivalent rent inflation was 0.34% monthly and 3.35% yearly (from 3.27%). Primary rents were up 0.36% monthly and 3.76% yearly (from 3.69%).
Jobless Claims Were Low Again
Forget about the decrease in job openings in December as jobless claims were low again in the week of February 8th. Initial claims rose 2,000 to 205,000. The 4 week average stayed at 212,000. 4 week average’s cycle low was 201,500 in April 2019. Claims are staying range bound instead of falling because there is little room for them to fall.
Conclusion
Inflation won’t be an issue for the Fed. It will make real wage growth look bad because energy inflation’s easy comp caused headline CPI to rise. However, the real-life effect won’t be negative because consumers are noticing a decline in energy prices compared to last month. Clearly, consumers aren’t concerned with inflation as their confidence is near the cycle high which is near the record high. Initial jobless claims were low again. Long live this nearly 11 year expansion.
Recent Comments