Yield Curve Has A Decent International Track Record
Investors buying stocks today are looking at 2019 earnings estimates to gauge their expected returns as they want to be on the bleeding edge of data to make the best decisions. However, given the anticipated recession in 2020, that the yield curve might be forecasting when it inverts in a few months, it’s foolish to not look further out into the future. It’s very difficult to predict where the economy will be in 2020, but that’s what needs to be done if you want to avoid the next bear market. It’s also what the Fed needs to do to avoid getting too tight. Based on current guidance, the Fed will get too tight as I will detail in this article.
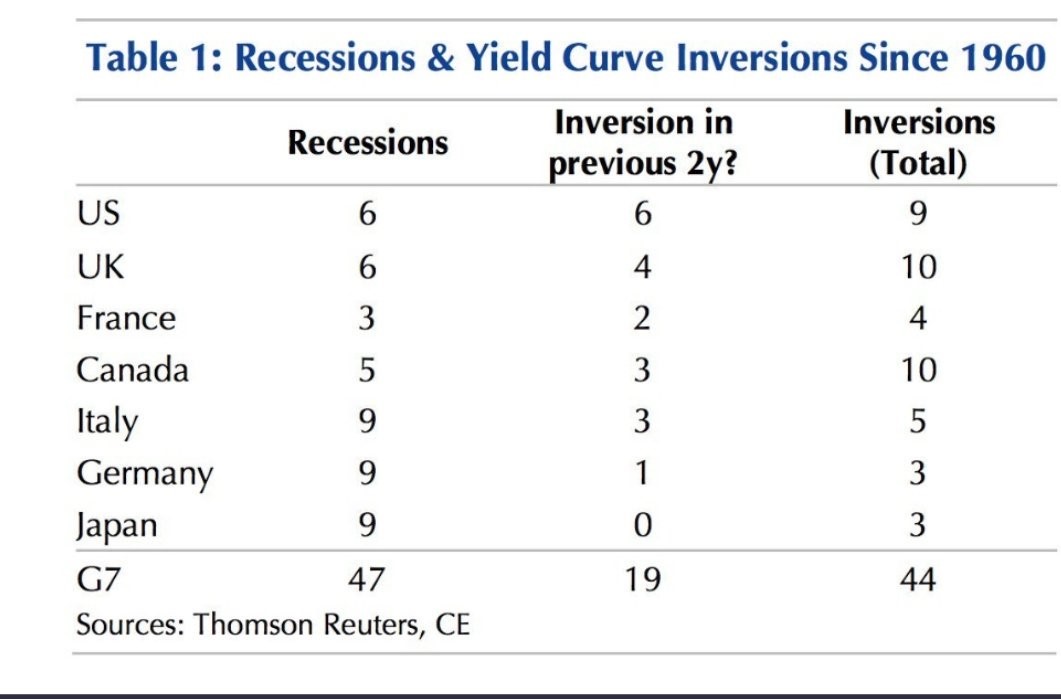
As I mentioned in a previous article, the international yield curves have become flatter year to date. The chart below shows the accuracy of the yield curve in the G7 nations since 1960. As you can see, there has been 44 inversions and 47 recessions. It appears to be the most accurate in America and the least accurate in Japan. There have been 9 recessions in Japan since 1960 and 0 inversions in the previous 2 years before the recessions. According to this chart, in America there have been 6 recessions and 6 inversions in the 2 years before the recessions. The 9 total inversions show there have been 3 false alarms. The reason I prefaced that point by saying ‘according to this chart’ is because I count 8 recessions in that period. The chart may use different qualifications recessions than what the Fed accepts.
Everything Has Changed In The Past 9 Years
It seems like the longer the inversion lasts, the more likely there will be a recession. There aren’t many data points to work with to determine if this is happenstance. It has become more difficult to predict recession now, in my opinion, because this business cycle has been very long. The market and the economy have changed so much since the last recession because of advances in technology, changes to demographics, changes in Fed policy. It’s tough to assess the risk of some changes like the increase in cove lite loans. It’s clear that we aren’t in another housing bubble or tech bubble like the past two cycles, but there will be a new black swan which catches most investors by surprise.
Neel Kashkari Is Worried About The Yield Curve
In a Medium post, Neel Kashkari explained why he’s worried about the yield curve flattening. The difference between the 10 year yield and the two year yield has gone from 134 basis points in December 2016 to just 25 basis points as of Friday. It’s great to read his article to see his understanding of the situation. The problem is he’s up against the rest of the FOMC and he doesn’t have voting power this year. When he had voting power in 2017, his votes were basically symbolic because he couldn’t convince others at the Fed to be more dovish.
Neel is not exclusively a dove. He switches based on the facts he sees. The point here is that he thinks the Fed is at the neutral rate, which means further hikes would make policy contractionary. He stated the following: “The fact that the 10-year yield is, so far, staying around 3 percent suggests that monetary policy, with a federal funds rate of 1.75 percent to 2.0 percent, is near neutral today. If the markets were expecting higher inflation or stronger real economic growth, that should be showing up as higher long-term bond yields.”
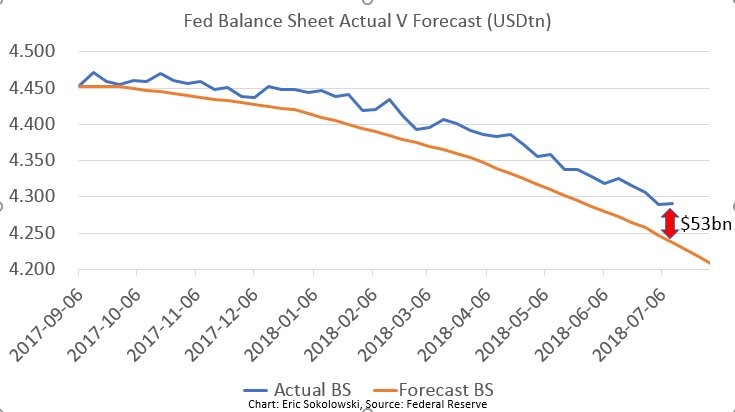
The Fed is selling bonds through its QE unwind program and growth and inflation are picking up. The chart below shows the Fed is $53 billion behind its balance sheet forecast. Nevertheless, the Fed is still selling bonds which should push up rates. The fact that the 10 year bond yield isn’t above 3% is a strong signal that the Fed is close to the neutral rate. I think the Fed will be at the neutral rate after one more hike. To be clear, that range would be from 200 basis points to 225 basis points.
An inversion signals policy is too tight because it shows the expectation that the Fed will cut rates next instead of hike them. It seems like at the current pace, a hike at the September meeting would coincide with an inversion. The situation is a bit more complicated than simply judging based on hikes because guidance affects the curve as well. If the Fed suddenly became more dovish, one more hike wouldn’t invert the curve. The three factors are timing, guidance, and actions.
This Time Isn’t Different
According to the Cleveland Fed, there’s only a 15.2% chance of a recession in the next year. The Fed claimed the curve is optimistic about the future economy. However, that’s ignoring the storm clouds on the horizon. Goldman Sachs says there’s a 10% risk of a recession in one year and a 20% risk in two years. Both stats are below the historical average. TS Lombard economists believe the 2 year 10 year spread doesn’t matter. They look at the 3 month bill’s spot price versus the 18 month forward implied price. They are wrong to act as if only the 10 year minus the 2 year is seeing problems. I look at all parts of the curve and I see flattening almost everywhere I look. They admitted the curve meaningfully inverted in 2006 which was almost 2 years before the next recession. This is why I don’t say to sell now. I’m saying to be cautious in 2019.
These points the skeptics of the yield curve are making equate to saying ‘this time is different.’ Neel disagreed with this point when he stated, “If the term premium were at its historical average, these policymakers say, the yield curve would be steeper and an inversion would be further off. This is the same argument some policymakers made in late 2006 to explain why they didn’t worry about the then-inverted yield curve.” He makes the point that the economy isn’t over heating. There’s no need to raise rates on a hunch about the term premium. Instead the Fed should be cautious and only raise rates when inflation and growth surprise to the upside.
Recent Comments