Hey trader,
Most traders enter a position with no objective idea of where price is actually going to stop.
They pick a round number or a prior high. Then they hope.
That guesswork costs you money. You cut your winners early because you have no conviction in the target.
You hold losers past their breaking point. You size positions blindly because you never calculated how far the move should actually run.
There is a way to project your next target using nothing but the channel price is already trading in. I used it on Salesforce today and price hit $191 almost to the penny.
Here is the math.
The Concept Behind Channel Duplication
Price tends to move in repeatable patterns. When buyers and sellers establish a rhythm, they continue that rhythm at the same scale even after the trend changes direction.
A $7 channel on the way down often becomes a $7 move on the way up. Another $7 move tends to follow after that.
That repetition is the foundation of the entire method. Once you can measure one channel accurately, you have the blueprint for the next one.
The method is built on measurement, not prediction. You are reading the scale of the existing move and projecting forward at the same scale.
What Makes a Channel Tradeable
Before the math works, the channel has to be real. Not every chart will qualify.
You need at least three touches along the same slope, measured off closing prices. The close is what matters because that is where price actually resolved each session.
Wicks and shadows will lead you astray. Extremes will mislead you in the same way.
The highest high and the lowest low are often outliers that do not repeat. Efficiency repeats, and the consistent touches along a trend are what you build off of.
If you cannot find three touches along the same slope, the chart is not tradeable with this method. Move on and find one that is.
Why the Math Works
A channel is a visual footprint of order flow. It shows you where participants have been willing to buy, where they have been willing to sell, and how consistent they have been about it.
When price breaks efficiency in the opposite direction, the same behavioral pattern tends to repeat at the same scale. That is why measuring one channel gives you the next target.
Consistency is what makes the math reliable. Efficient moves produce targets you can count on.
The Salesforce Walkthrough
Salesforce gave me a clean example today. I drew the channel off the close prices and found multiple efficient touches along the same slope.
The channel height measured roughly $7.
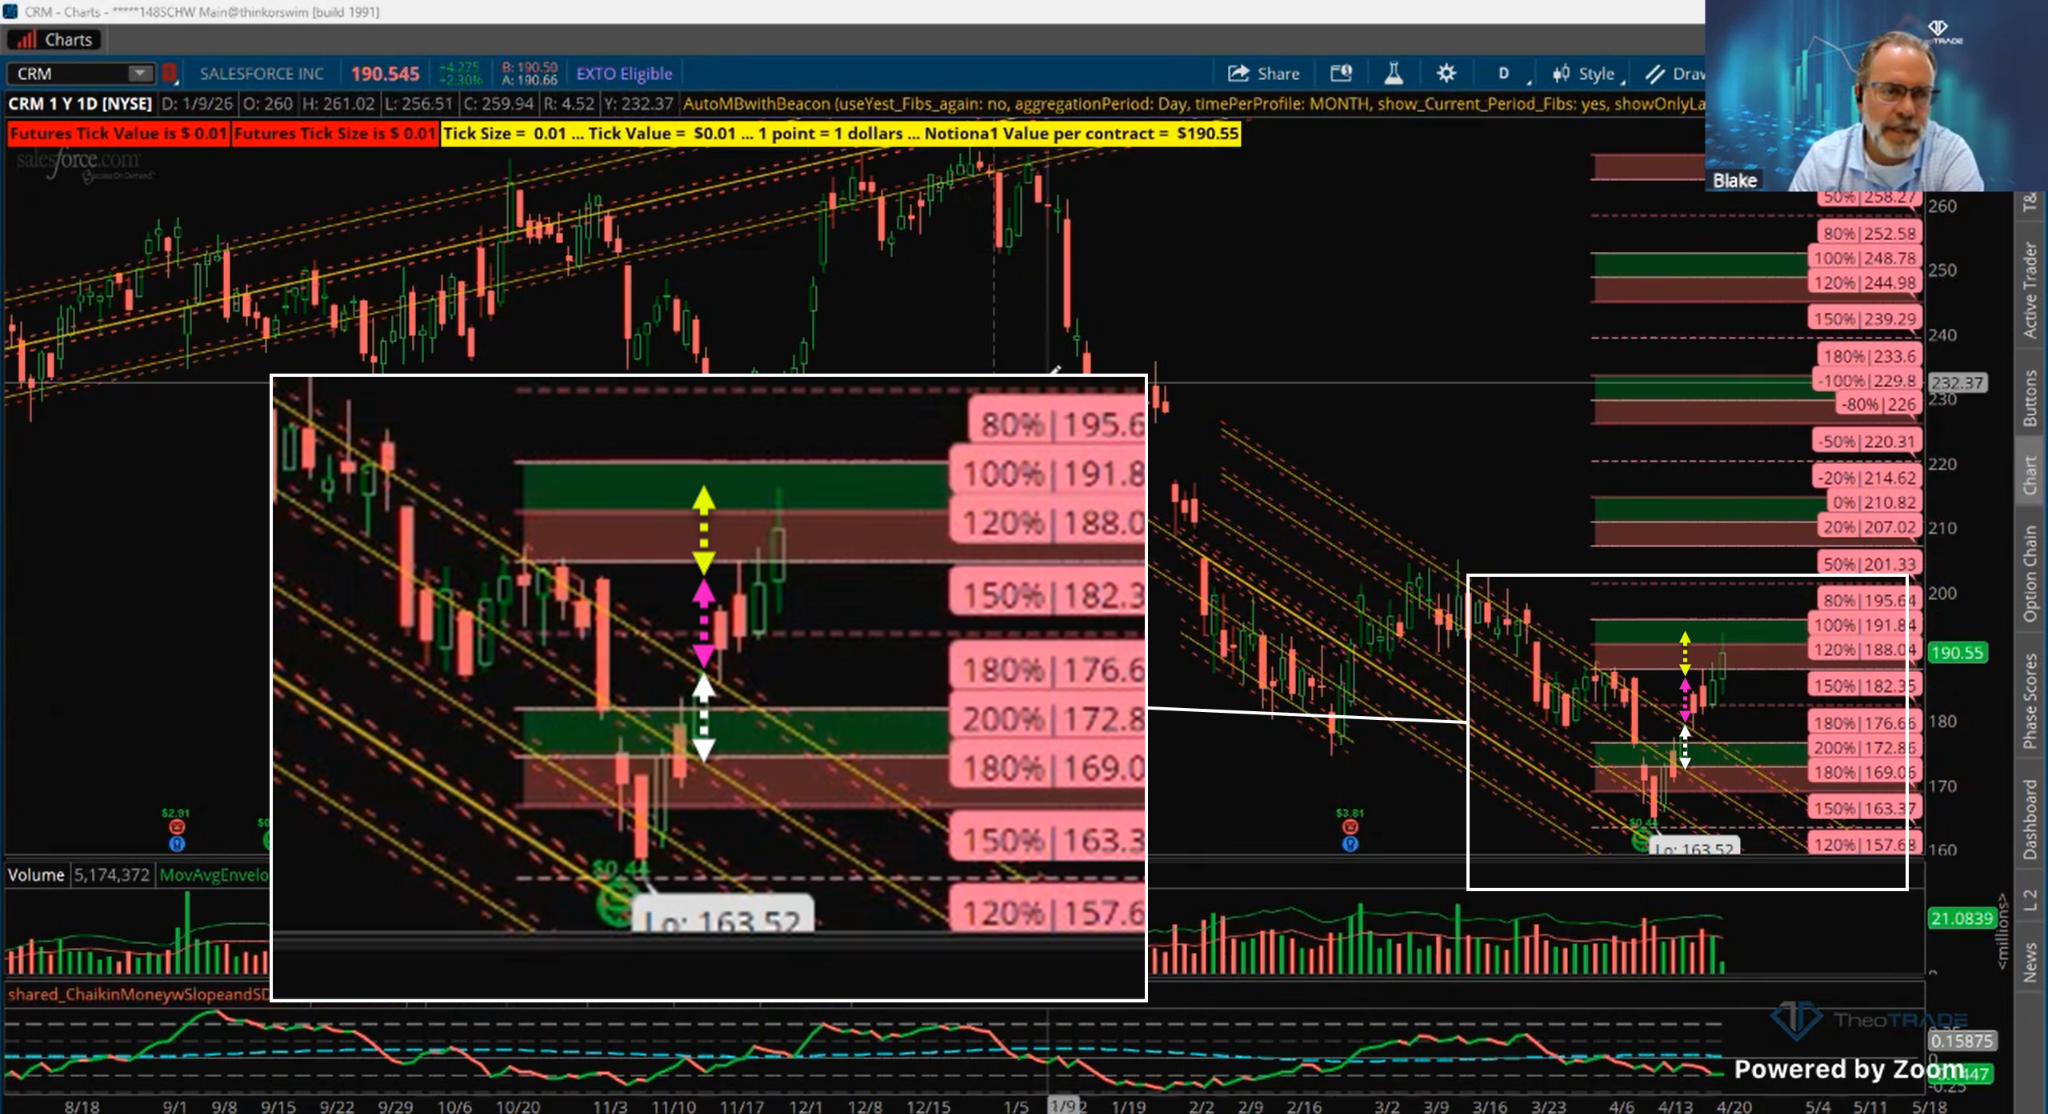
When price broke out and started moving higher from around $177, the first target was one channel height up at $184. Price hit it.
The move then duplicated a second time, running another $7 higher. Price landed at $191 almost to the penny.
Two channel heights above the breakout. Both measurable in advance, and both reached.
How to Apply This
The method comes down to three steps.
First, find three touches along the same slope on the close prices. If you cannot find three, the chart is not ready for this method.
Second, measure the channel height. Top close of the channel minus bottom close is your unit of measurement for every target that follows.
Third, duplicate in the breakout direction. The first target is one channel height away, and the second target is two.
Not every chart will cooperate. CRDO came up during the session today and I could not find three clean touches in the same slope.
When a chart does not give you the inputs, the method does not apply. Walk away and find one that does.
The Takeaway
You will not predict every move, and you do not need to. What you need is measurable targets instead of guessed ones.
Channels give you that measurement. Duplication tells you how far the next move should run.
The traders who size positions correctly, lock in profits at the right levels, and stay out of unreadable charts are the ones who stay in this business for the long term.
Build the habit now. Pull up a chart, find three touches, measure the channel, and duplicate in the breakout direction.
Your next target is probably sitting there already. You just need to do the math.
👉 Click here to learn more and join us.
Blake Young
Senior Market Strategist, TheoTRADE