
Hey trader,
Tuesday was a mess. The VIX ripped to 20. The indices knifed through May’s lows.
On a tape like that, the levels you drew at the open are already junk. Price runs right through them. It grabs your stop a tick early, then turns and leaves without you.
One read held up anyway. I look for the spot where one side got run over on the chart. Whoever got steamrolled left orders sitting there. Price comes back for them almost every time.
That spot becomes my next target. I called it on the NASDAQ, the ES, and crude Tuesday, and price walked right into the levels.
So let me hand you the whole thing: How to mark those spots. How to trade into them. Where to tuck your stop so the crowd gets swept and you don’t.
A Violent Tape Is Where This Earns Its Keep
On a slow day, price drifts. Levels barely get tested, and you can get away with sloppy marks.
A day like Tuesday gives you no such grace. Price rips through structure, and every break hands you a fresh entry, target, and stop.
That is exactly what played out. The same method called level after level as the market tore lower.
Find Where One Side Got Run Over
I do not mark supply and demand off the high touch or the low touch.
I mark it where one side completely ran over the other.
Picture a wall of sellers leaning on price. Then a fat green candle comes in and blasts right through them.
That candle is a footprint. It tells you there were leftover buy orders sitting in that zone, big enough to flip the fight.
Those orders do not vanish when price leaves. They sit there until price comes back and trades through them.
The rule is simple: Until price closes past that zone, the buyers are still in there waiting.
Watch It Work in Real Time
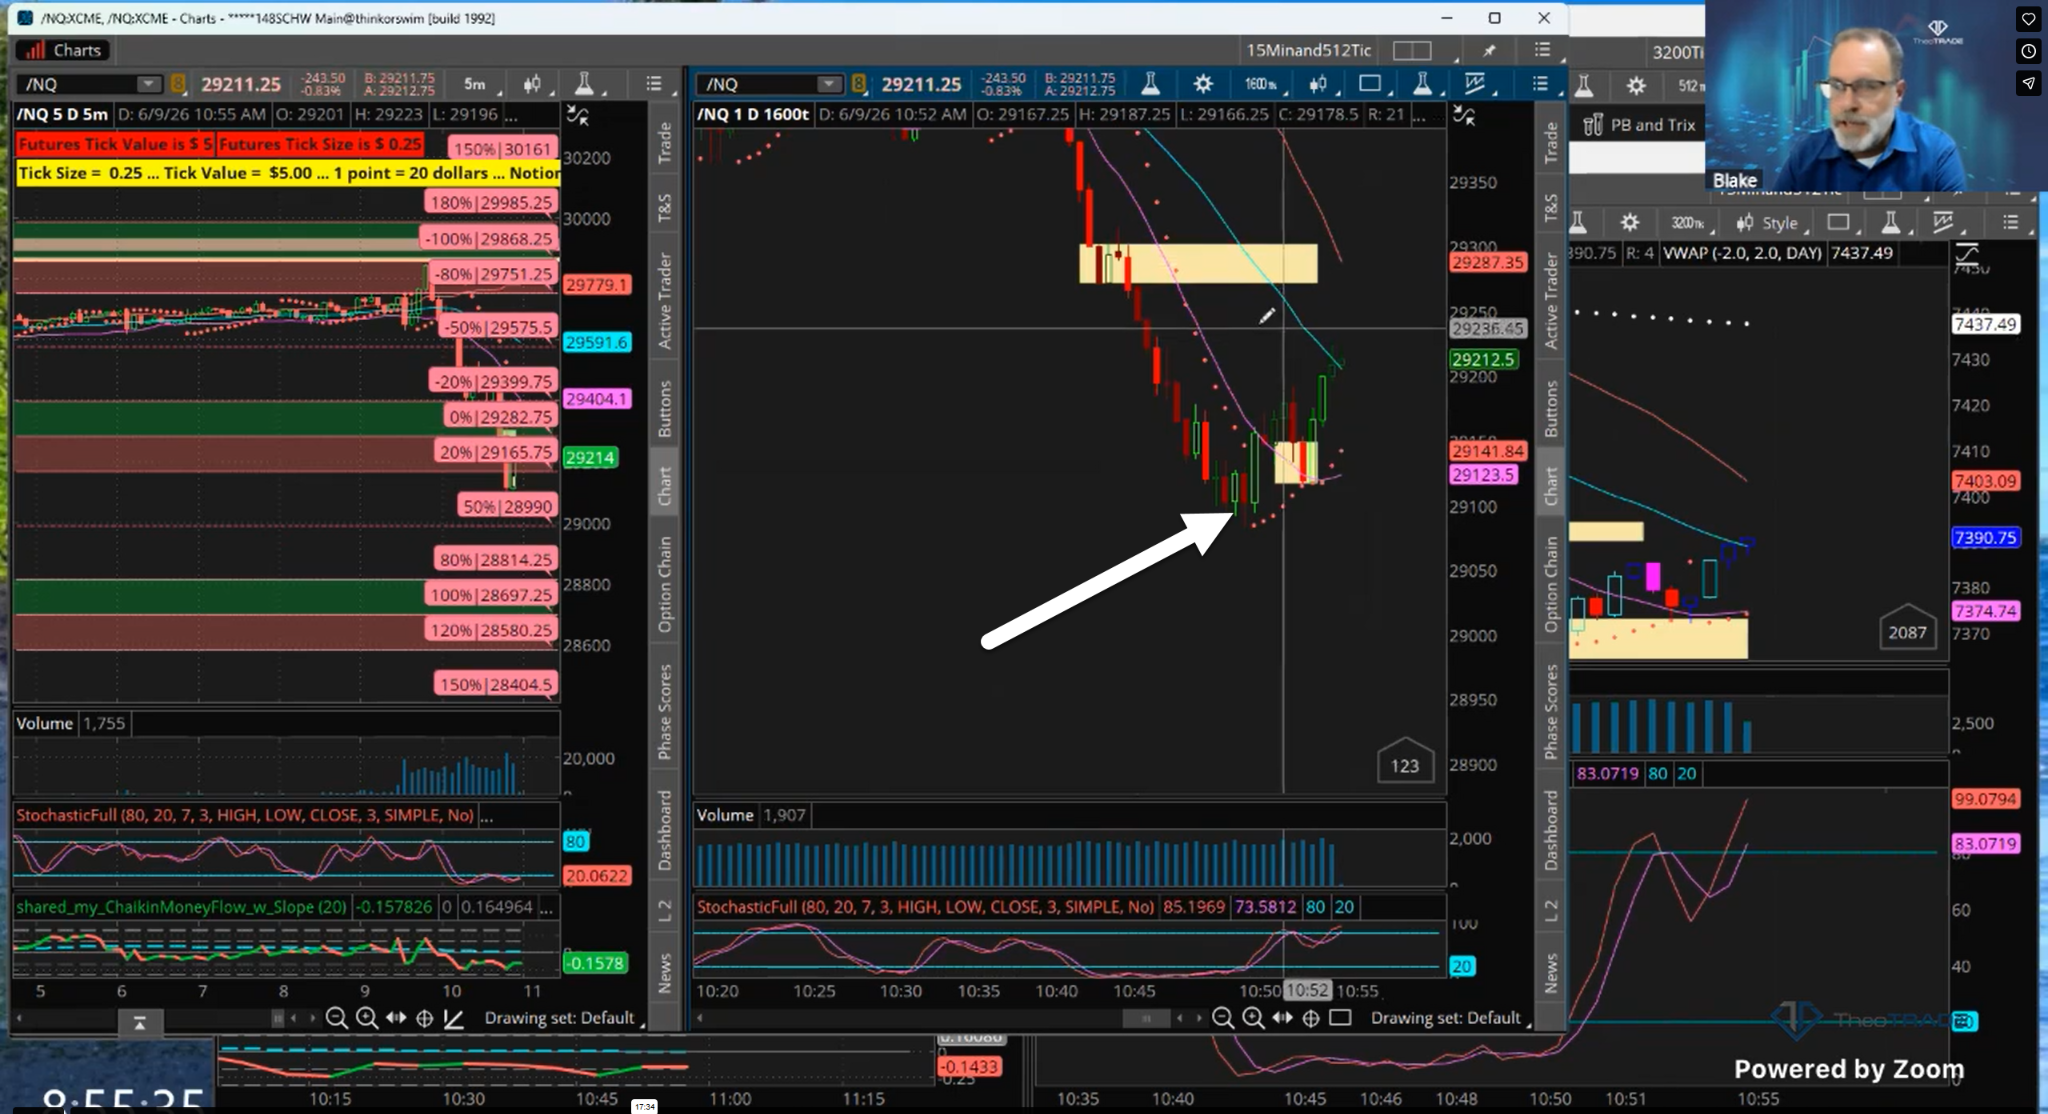
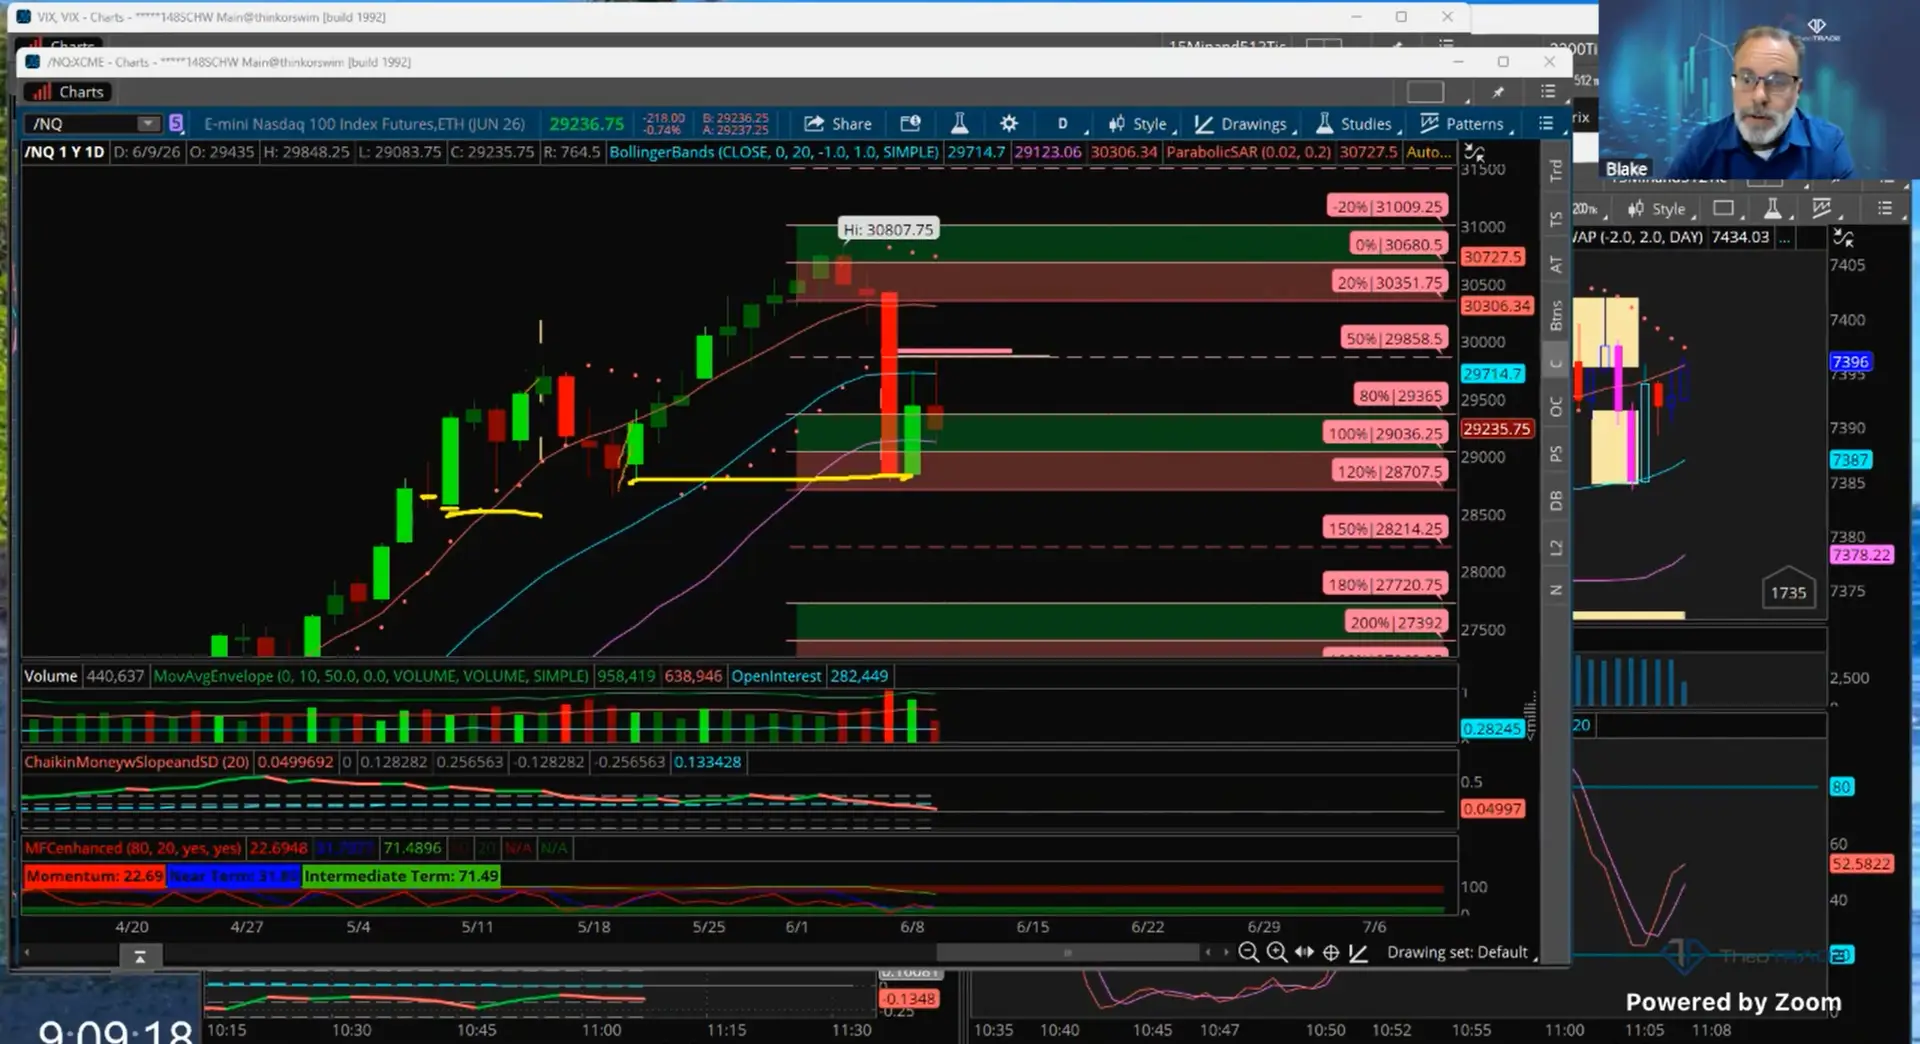
Take the NASDAQ early Tuesday. Sellers had control, then a big candle cleared them out and closed above the high.
New buyers stepped in and stacked higher highs and higher lows. I marked the level to watch at 29,271 while price was still sitting down near 29,220.
Price ran 50-plus points straight up into that zone, tagged it, and rejected. The level did its job to the tick.
The ES gave an even cleaner read. I marked where buyers were stacked on the bigger picture after the index had already fallen hundreds of points off its high.
Price came down and stopped roughly two points from the level I called. Two points, after a drop that size.
Crude told the same story by the end of the morning. I had buyers defended at a demand zone, with the line in the sand set at a close below the low.
The moment crude closed below that zone, the rest of the buyers were gone. It broke and ran, clearing the next level with nothing left underneath it.
Why Your Stop Got Swept at the Exact Tick
Here is the part that saves you real money on a tape like Tuesday. The zones you can see are visible to everyone else too.
You put volume on the chart and it shows you where the orders are. Every other trader staring at that chart sees the same picture.
So your stop lands in the same spot as a few hundred other stops. That cluster turns into a magnet.
Price gets pushed through just far enough to clear all of them. Then it turns and runs the other way.
It feels like the market hunted you personally. You read the tape correctly. The catch is that everyone else read it the same way.
The fix is to quit parking your stop at the obvious level. Put it behind the biggest group of orders instead.
Think of a playground fight. You want to stand behind the biggest kid there.
Ask yourself one thing before you click. If price takes out that whole group and there is nothing left behind it, are you comfortable being wrong?
Then give yourself a few extra ticks past the zone. Let them sweep the crowd without sweeping you.
There is a second piece to this. A wick that pokes below a level does not break it. A close below it does.
An intraday wick will shake you out and leave the trade thesis fully intact. Wait for the candle to close before you treat a level as dead.
How To Run This Yourself
Start by finding the candle where one side took over. Mark from the top of the red candle to the bottom of the green candle that ran it over.
A bigger candle through the zone is a stronger footprint. It means more orders got left sitting there unfilled.
Then stair-step it. Every time price closes past one zone, the next zone back becomes your target.
Use a tick chart for this, not a time chart. Ticks count trades. Trades are where the orders actually live.
I run 1,600 ticks on the NASDAQ and 3,200 on the ES. That keeps each candle around $200 of movement per contract. That is enough room to manage risk on.
I will not trade for one or two points. There is no way to manage risk that tight. The commissions eat whatever edge is left.
When the tape is moving this fast, you need one method you can run on every chart in front of you. Find where one side got run over. Trade toward the orders they left. Wait for a close before you call a zone dead.
Entry, stop, target, every time, no exceptions.
Click here to learn more and join us inside The 10AM Bell.
Blake Young
Senior Market Strategist, TheoTRADE