Hey trader,
I have sat in an airport with the market open and real money on the line. The ThinkorSwim platform crashed.
Every chart I lean on went dark. I could have traded off my phone.
Plenty of people do. I refused.
I will not trade off my Samsung. If I cannot see it, I will not trade it.
Trading without an oscillator is like flying an airplane without instruments. That instrument is my eyes and ears.
I have watched a trader brag at the bar about being up 80 points. Ten minutes later his margin call landed.
He never checked his gauges. The oscillator was telling him to get out.
Today I want to slow you down and hand you that same instrument.
Because most people don’t actually understand how to use it. They assume it predicts the future. That’s not how it works.
That’s why I’ll dig into my favorite, so you know not only what it is and why I rely on it, but how you can apply it today
What a Long-Term Oscillator Actually Does
Oscillators come in three varieties: short, medium, and long-term. We’re going to focus on the long-term oscillator.
Now, contrary to popular belief, an oscillator does not predict. It manages risk. It flags a change of direction.
As an indicator, it swings up and down inside fixed ranges, usually between zero and 100 (known as a bounded indicator)
Think of those ranges as goalposts. The thresholds are there to guide your positioning long and short.
It converts raw price action into one clean reading. That reading is momentum.
The long-term version matters most here. You miss the forest when you press your nose against the intraday chart. The long-term read keeps you above the trees.
For today, we’re going to focus on my favorite one, the Relative Strength Indicator or RSI for short.
The Overbought Misread
Traders hear “overbought” and slam the sell button. That reflex has cost people fortunes.
Overbought is a condition. Oversold is a trigger.
A condition can last far longer than you expect. This market has been overbought for six months.
It cannot even tick down for 15 minutes. Algorithms have flattened the swings.
An oscillator lives on volatility. Crush the volatility. The reading falls into a slumber.
The instrument does not scream sell today. It tells you the risk is stacked against you.
How I Read It Day by Day
I read my oscillator like a driver reads the road.
I watch it every day. I decide whether to add, to hold, or to exit.
I pulled up GE as an example during my teaching session. It gave a clean look at a bounded oscillator.
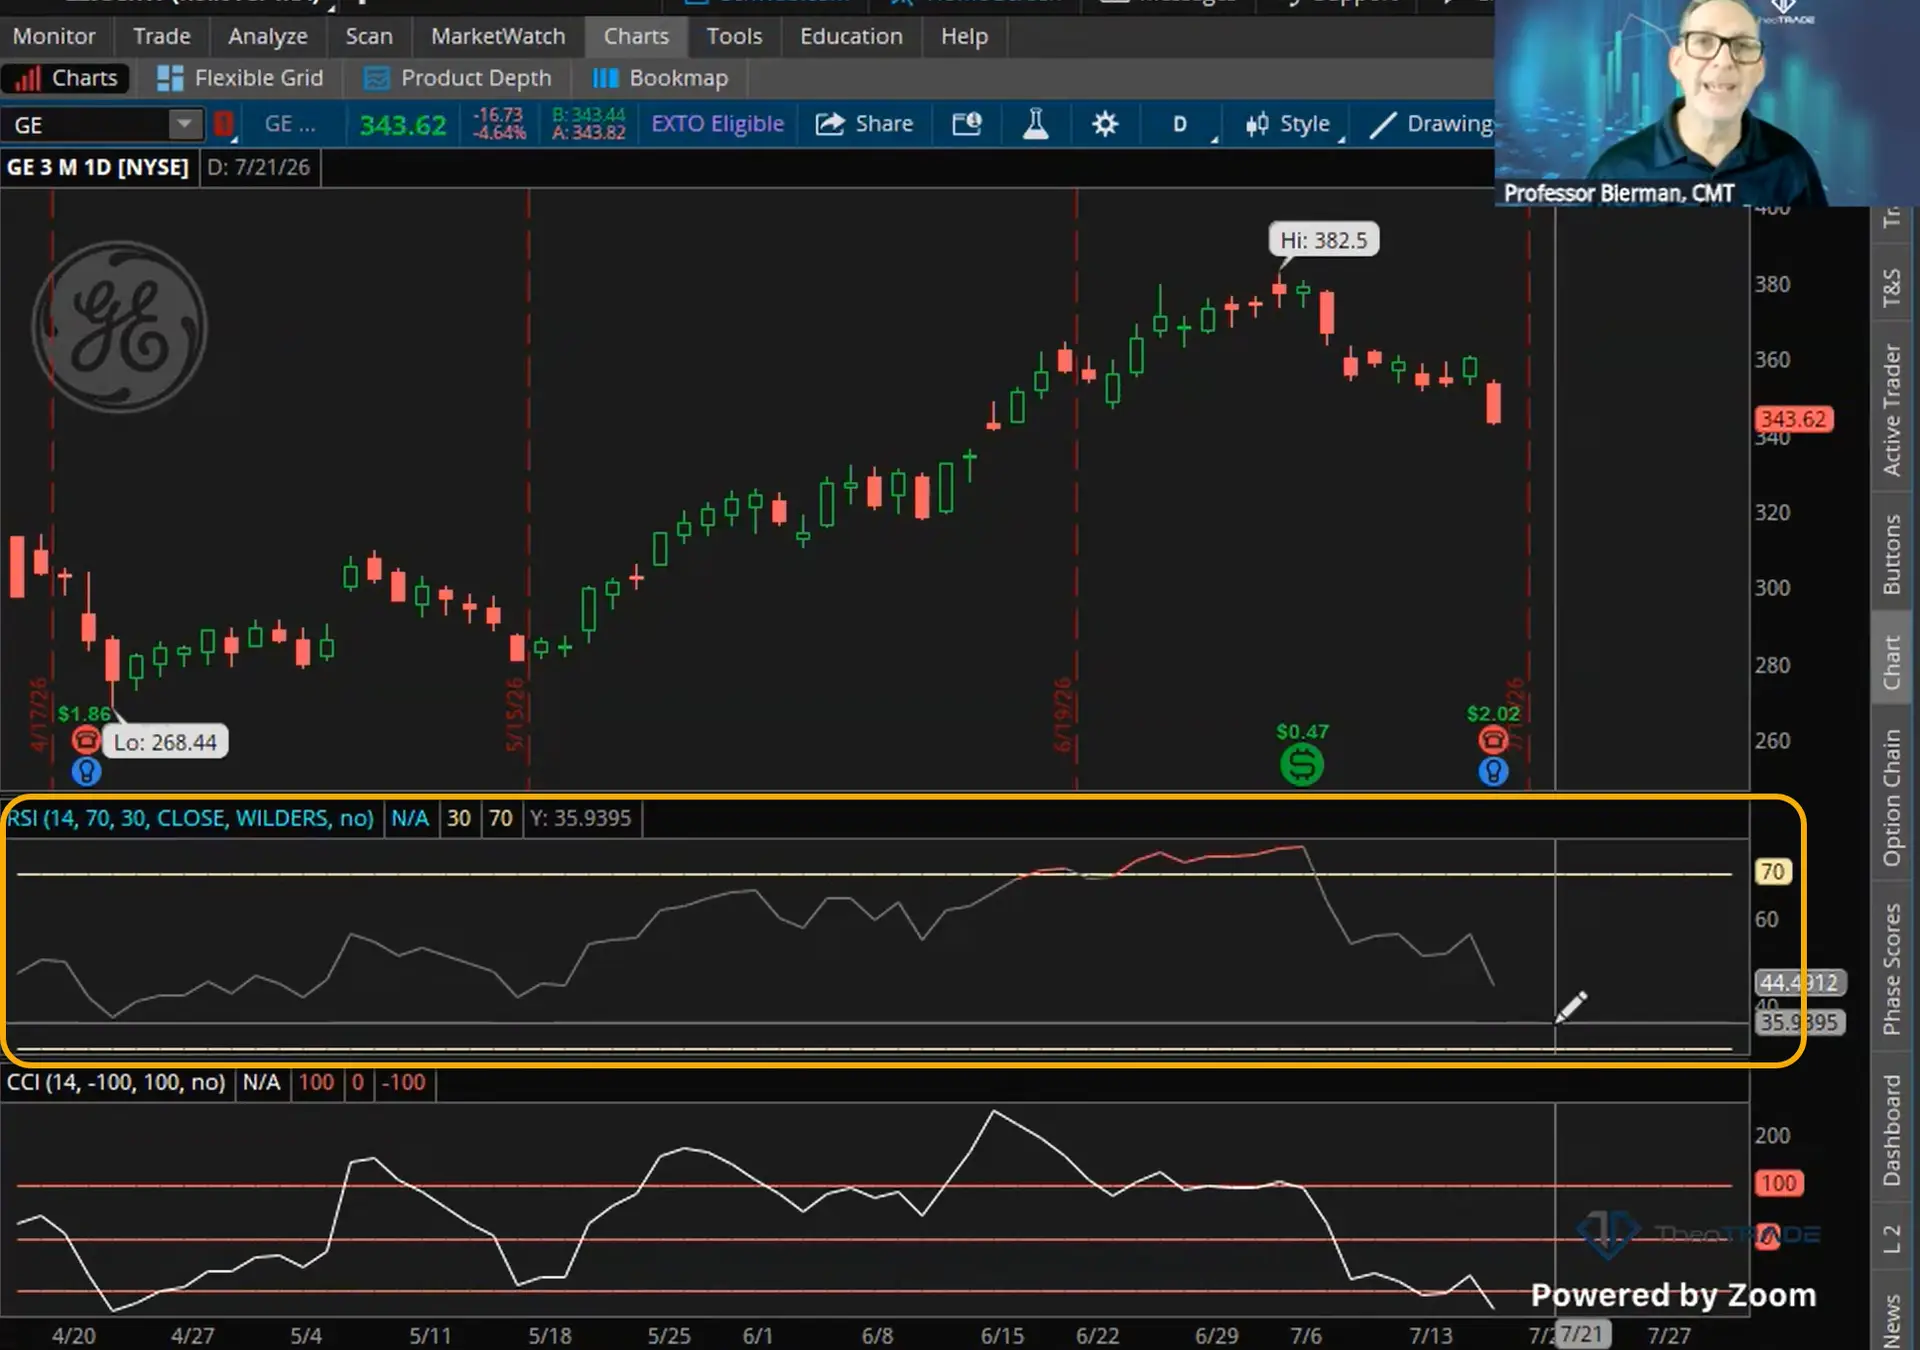
The same read works on a stock you plan to hold for years.
Someone tells me they want to own IBM for three years. That is my kind of trader.
I pull up the long-term oscillator first. It shows me where the stock is safe.
It shows me where it turns vulnerable. It shows me how much room is left to move.
I make glacial shifts with this read. Small, patient moves capture the massive ones.
That patience paid me 2.5% on a flat day. Positions that sat dead for months finally broke out.
When I do lose, I lose 3% to 5%. It rarely happens.
The oscillator points you to entries where the risk is lowest. It marks the danger zone where you stand aside.
Come Learn to Read the Instruments
You would never board a plane with a blind pilot. Do not run your account as one.
The long-term oscillator is your instrument panel. It tells you when to hold, when to hedge, and when to stand aside.
Inside the Burn Signal System, I show you the full read from entry to exit.
You learn where the risk is lowest before you commit a dollar.
Come sit on the smoothing plane with me. Slow down and see what I see.
Professor Jeffrey Bierman
Creator of the Genesis COG System