
Hey Trader,
I watched traders ride Micron from $300 to $800.
With more than 200% in the bag, they used a reversal candle to take profits.
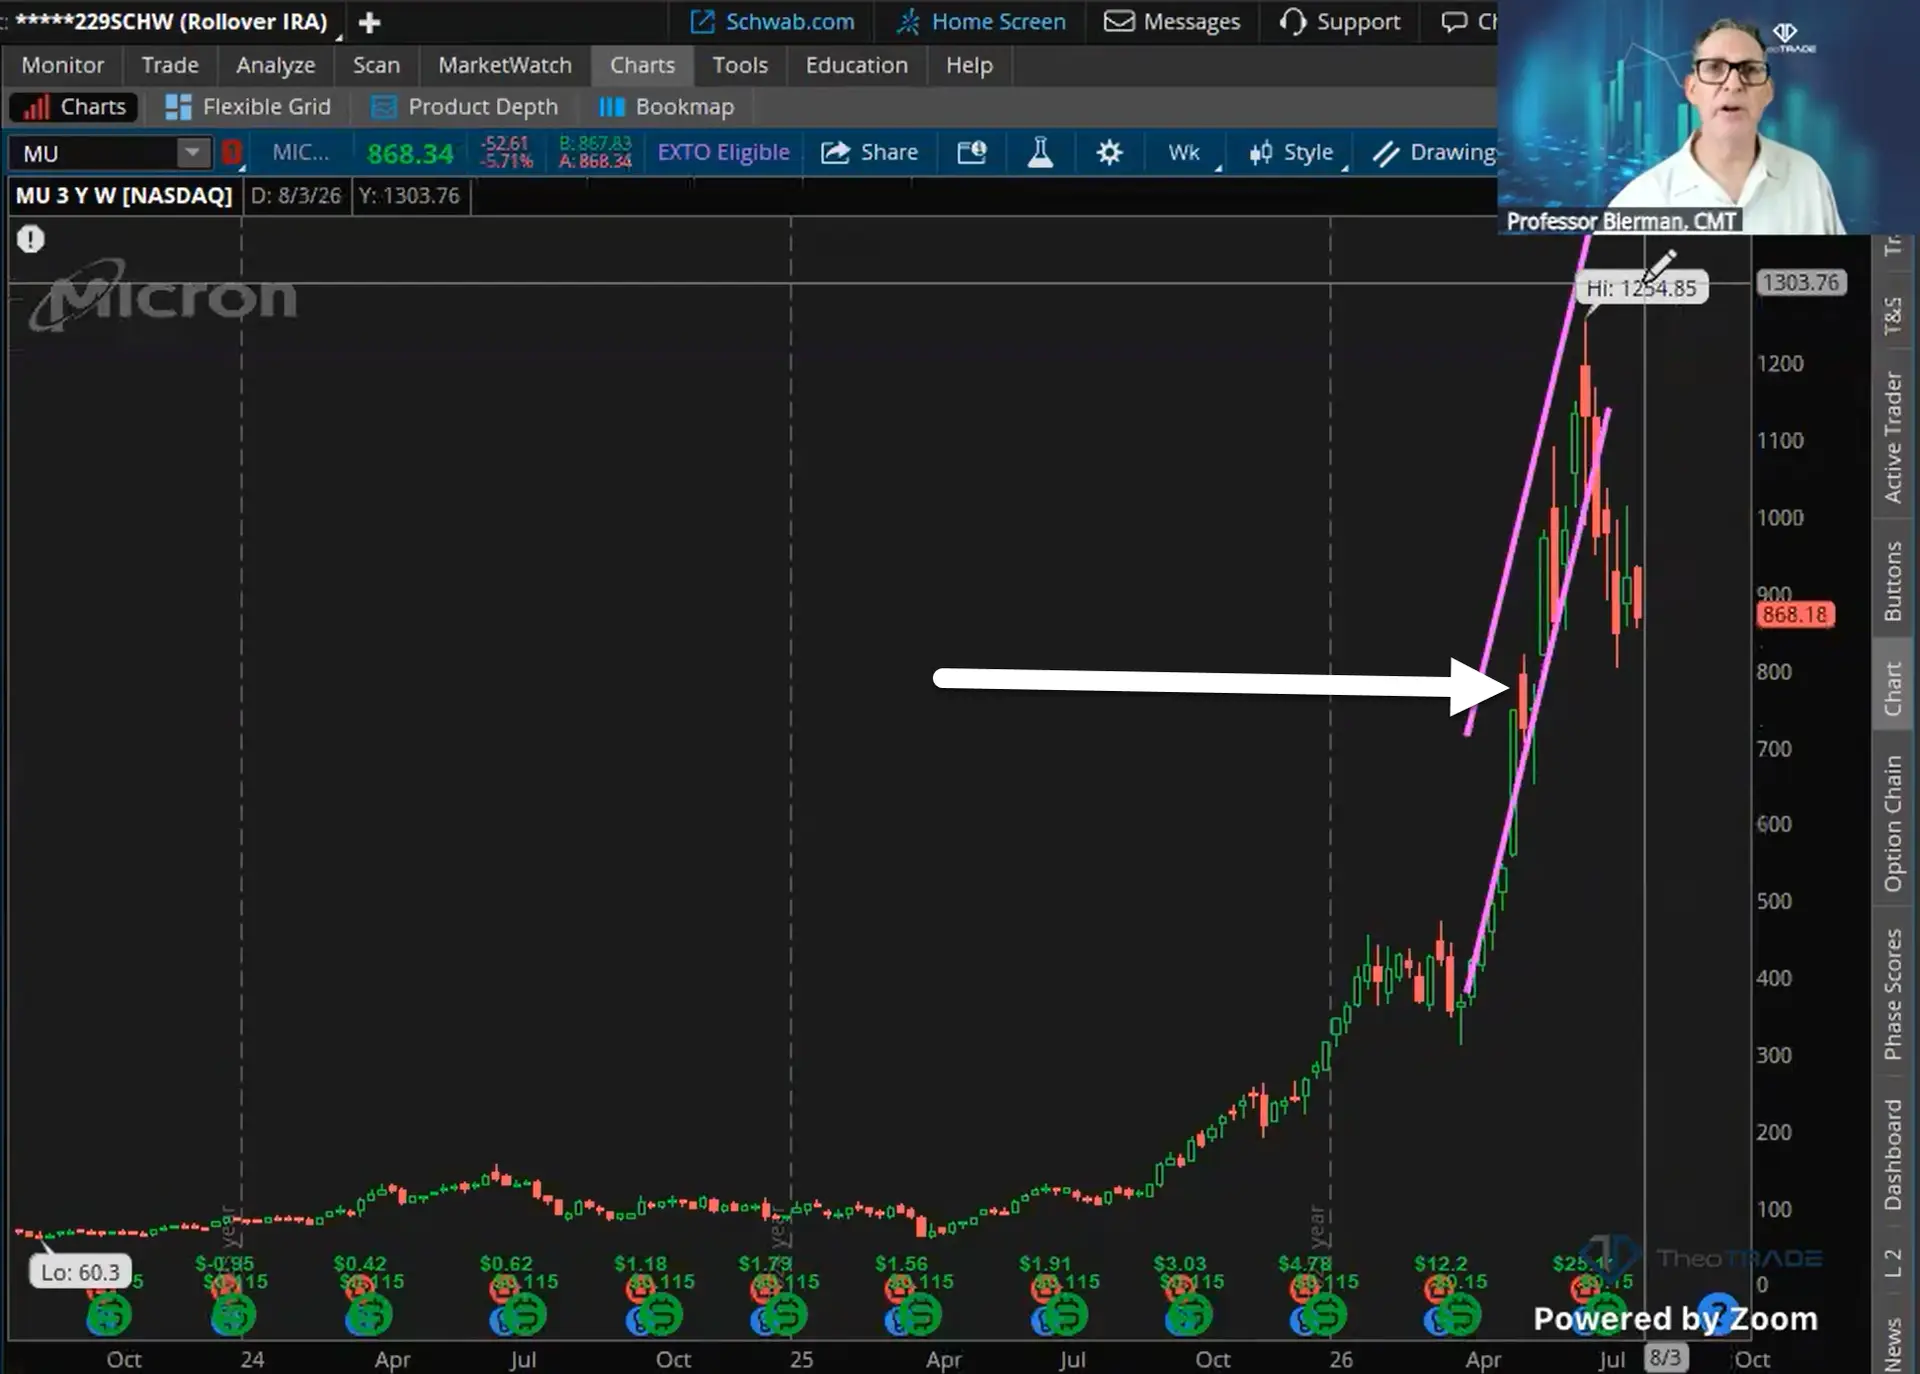
They then watched Micron run another 500 points before it finally topped out.
Now, I’m not saying they did anything wrong.
But a lot of traders take profits early and hold losers into oblivion.
Obviously, I advocate for the opposite.
However, I’m not suggesting you do it without any framework or plan. Instead, I want to give you something that can help you determine when it’s time to ring the register.
It’s a little something I like to call Momentum Duration.
Don’t worry if you’ve never heard of it before. It’s not a well-known concept.
Yet, after today, you’ll understand how it can help you squeeze the most out of your trades and give you more certainty when you take profits.
What Momentum Duration Actually Measures
Momentum measures the rate of change in an asset’s price or volume over a set period.
Duration tells you how long that rate of change can sustain itself before the trend gives way.
Most traders only look at momentum. They never bother with duration, leaving them with only half the equation.
Momentum sits underneath trend as a subset of it. Trend hands you direction. Momentum hands you velocity.
I split momentum into two buckets.
- Immediate momentum runs a week or two.
- Duration momentum runs three months or longer.
That three-month line is mine.
Four things determine duration, and I weigh all four before I enter.
Those are the:
- Slope or angle of the trend
- Price and time together
- Magnitude of the move
- Sustainability.
Sustainability decides whether you keep the gain. It also decides whether a loser releases you in two weeks or two years.
The Slope Tells You the Shelf Life
Slope is my obsession. I have built indicators and algorithms, and I still return to the channel slope on every trade I take.
A move climbing at 82 degrees cannot hold. It burns its fuel and flames out inside weeks.
A move grinding along at 45 to 50 degrees behaves nothing like that. It sustains for a year or longer, which is precisely how it fools you.
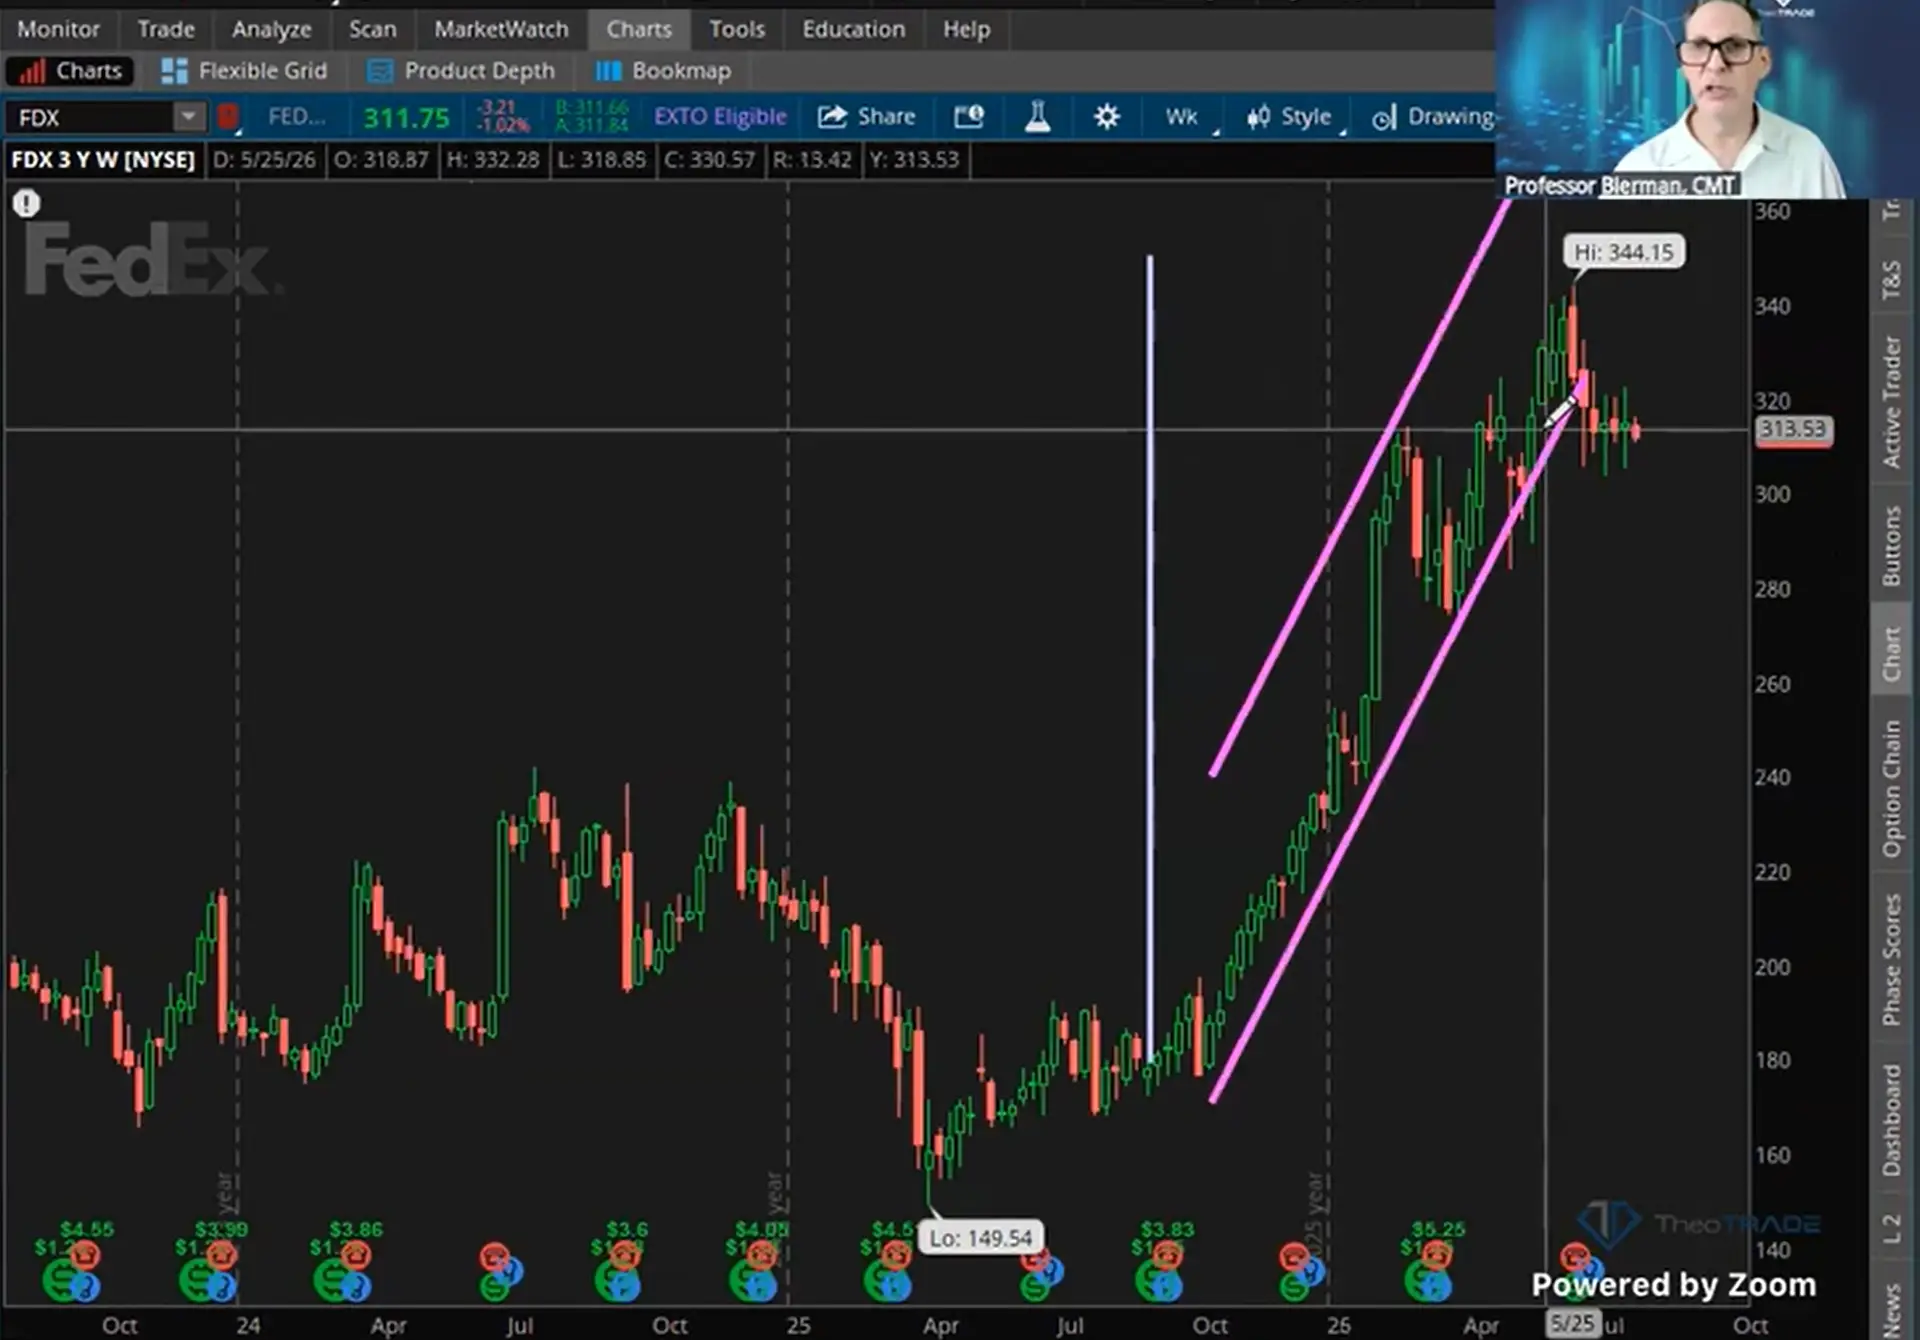
Federal Express showed this cleanly. The bull run broke out on October 6, 2025, and nine months passed before the stock closed below its channel.
Price traded below that channel several times along the way. It never closed below it, so the algorithms defended the line every single time.
Trading below and closing below are two different animals. I never put them in the same sentence.
Micron Ran on a Slope You Could Measure
Micron climbed on a sustainable angle. The traders who sold read the size of their gain and called it enough.
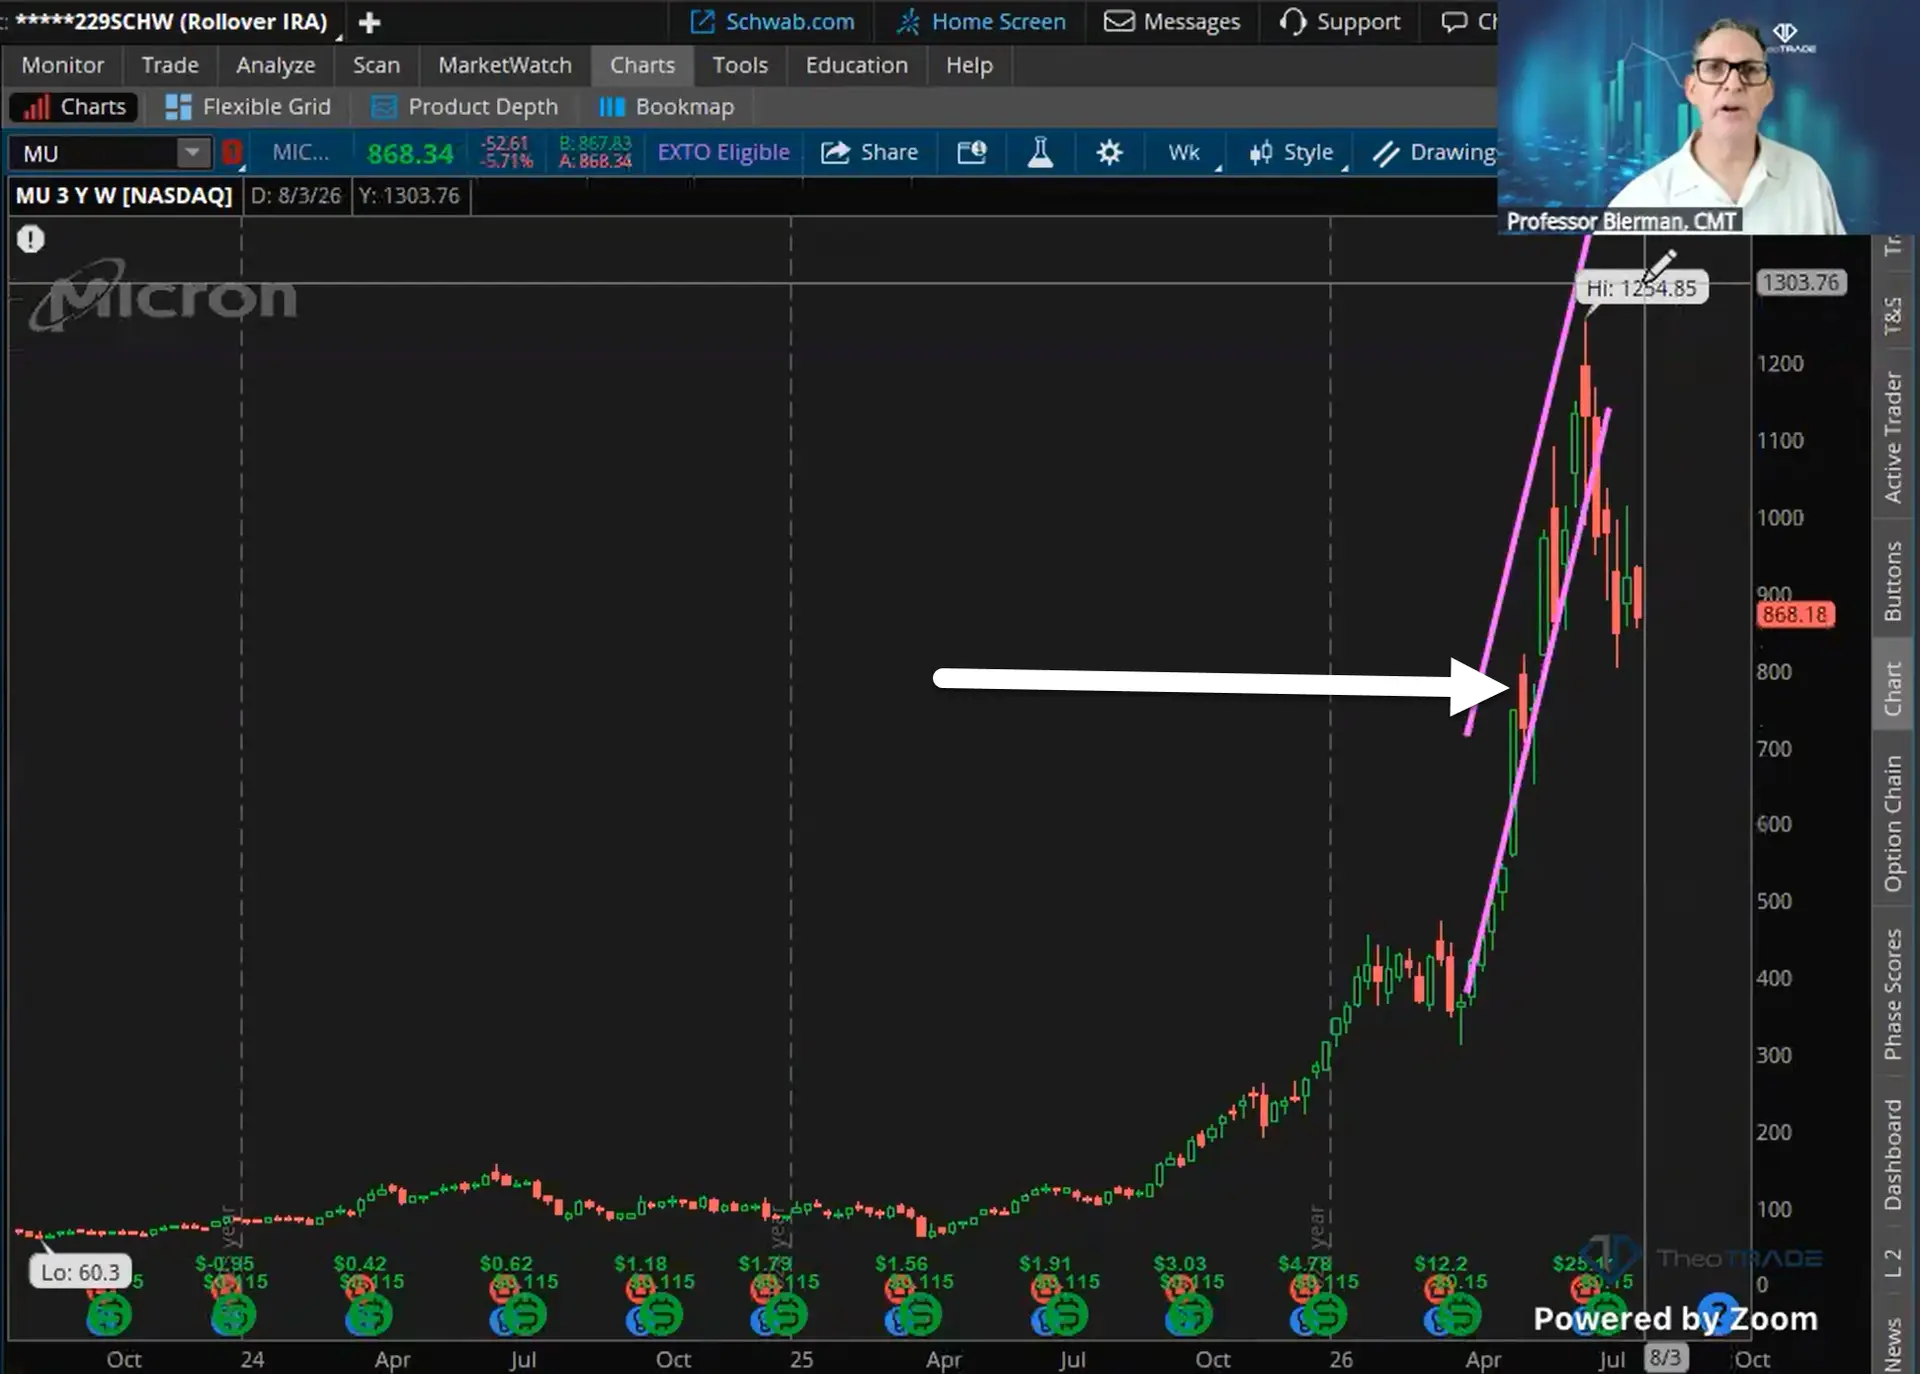
They had no read on the duration. The channel still held, so the algorithms kept buying, and the stock tacked on another 500 points.
The break did arrive. Micron will not revisit 1254 for a long while, and it may see 500 before it retests anything above.
The exit was correct. It landed roughly 500 points early.
How to Put This to Work Tomorrow
Pull the angle before you enter. Your data box gives you the slope in degrees, and that number sets your expectation for how long the move can live.
Steep readings tell you to take the money quickly. Shallow readings tell you to sit still and let the channel work.
Then hold the winner until price closes below the channel. A close below rewrites the algorithmic complexion of that stock, and that is your cue to ring the register.
Do not measure momentum in isolation. Complement the slope with a trend strength read and a smoothing factor out to 50 or 200 days.
The same discipline protects you on the losing side. You never buy a downtrend, because that is a Genesis COG rule, and a downtrend grinding at 45 degrees will not let you go on its own.
Gianni put it in one line, and I will quote him. Ride your winners, and cut your losers as best you can.
Duration momentum decides which of the two you are actually holding.
Professor Jeffrey Bierman
Creator of the Genesis COG System