
Hey trader,
You had a good short on the ES today. Price bounced once and you were out of it.
That happens when you never had a target you actually believed in. Your chart hands you six opinions and none of them agree.
Guessing at the exit costs you more than being wrong on the entry.
At midday I checked my ES target three different ways. Two of those readings landed on the exact same number.
The third told me the bounce was not worth taking.
I’ll show you how I built that number and how to run the check before your next trade.
Yesterday’s Chart Set The First Target
Mondays are Monkey Bar Mondays in my room. I take the projected forward levels and carry them into the next session.
Think of it like a sports bet. You look at what a player averaged over previous games, then you set your expectation for tonight.
The projected levels gave me a bearish trigger below 7762.50 on the ES. Price traded through that low and broke out of the monkey bar at 7759.
That breakout carried a target of 7753.50. I had the number on the board before I said a word about today’s tape.
Today’s Volume Confirmed The Direction
The developing volume profile is a different animal. It only counts what has traded today, and it rebuilds itself all session long.
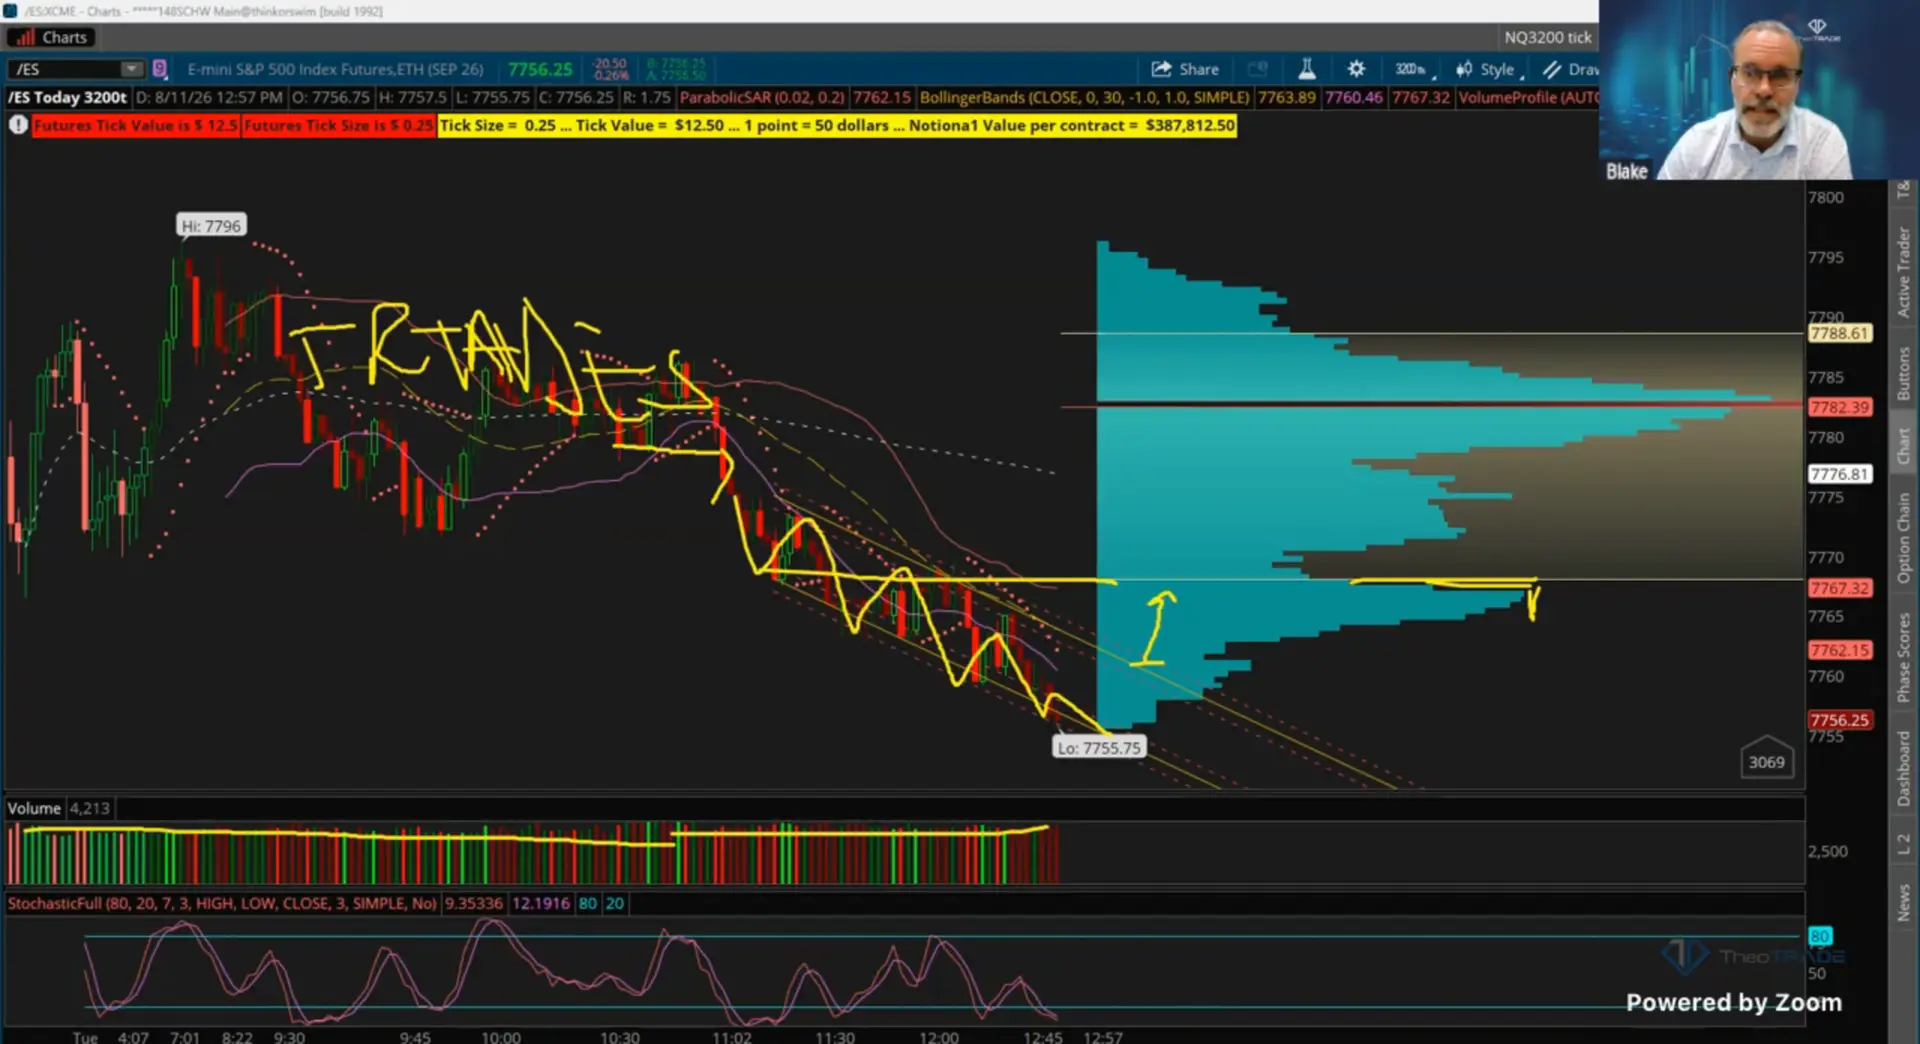
Price broke through the lows around 11:30 Eastern. That gave us close to two hours of steady selling into the time I went on camera.
We sat below the point of control and below the VWAP. We had lower highs and lower lows inside an efficient downward channel.
A break of that channel at 7762 projected only seven points of upside to 7769. That move would not have touched the value area low.
I had no bullish input anywhere on the chart. There was no divergence, no base, and no slowdown in the sell volume.
That profile gave me direction rather than a fresh number. It kept the target I already had in play.
The Options Chain Produced The Number
Mid-morning I pulled the one-day ES implied volatility expected move. It came back at $13 with price near 7768.
That math put the move at 7755. Price cut straight through it.
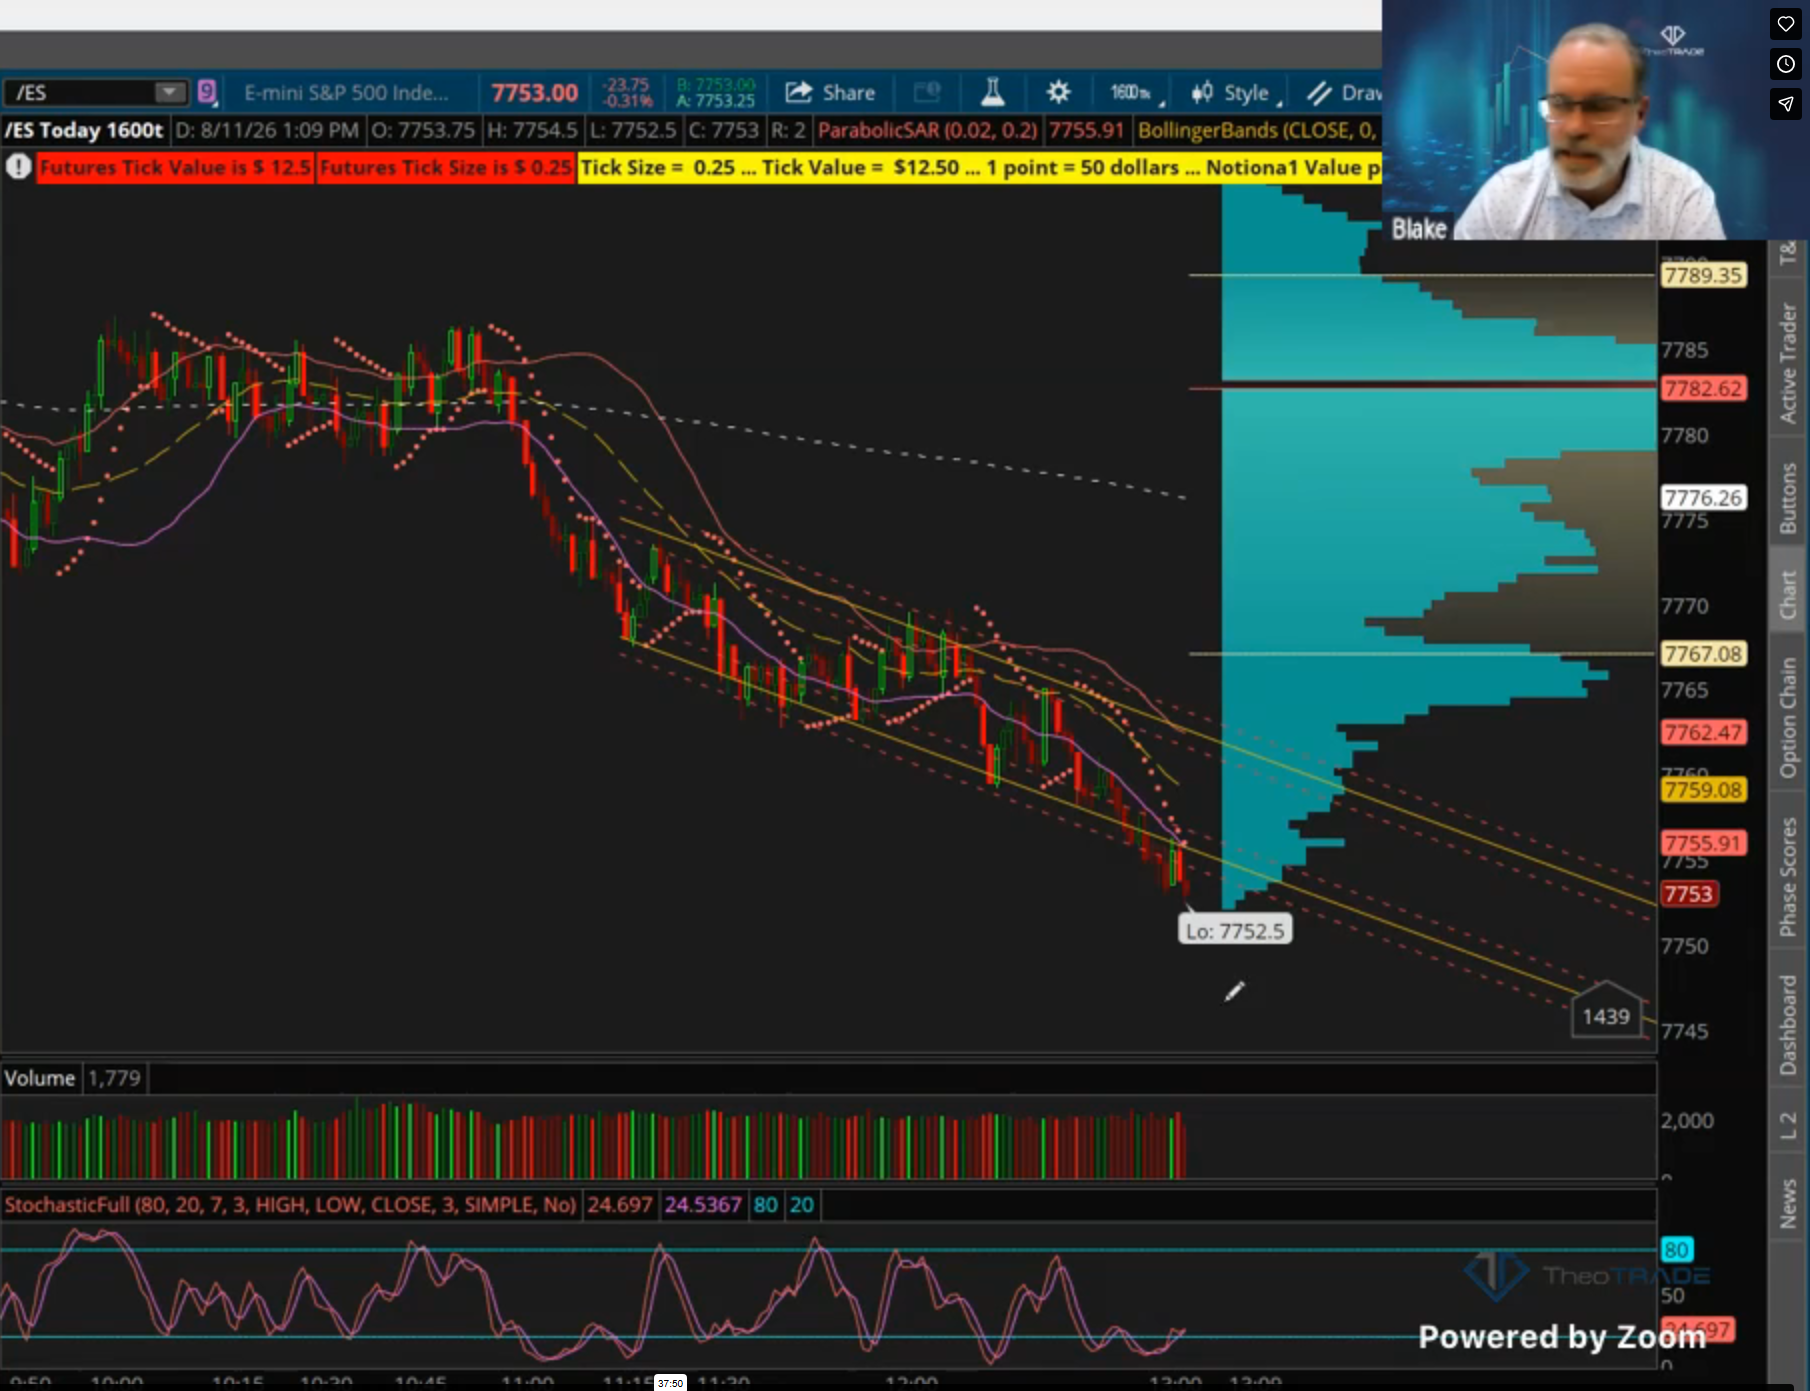
By the time I was on camera, the zero DTE expected move had shrunk to $11. Price was sitting at 7753.
Take $11 off 7753, and you land on 7742. Greeny already had 7742 on the board from the expected move calculated at the start of the day.
Those two readings came hours apart from two different price points. They calculated the same target within a point of each other.
Why Agreement Beats Any Single Indicator
When your projected levels, your developing profile, and your expected move all point at the same area, you are reading the tape correctly. That agreement is the confirmation.
It shows up everywhere once you start looking for it. Here are three examples from the same hour of the session.
- The Russell hit 3044, which was both the monkey bar target and the value area high. Price closed back inside, and that close is your signal to take profit and walk away.
- Microsoft showed projected fair price at 501.39 and built today’s fair price at 501.30. The agreement between those two gave the short at 503.90.
- Consumer staples went bearish below 84.83 on the projected level and stayed bearish below the developing point of control near 85.
Blake described the same idea at the top of the hour from the options side. He paid 65 cents for an XSP put yesterday and watched it go in the money by 63 cents, a $3 loss.
The dealers priced that level to the penny because they hedge at specific increments. Volume builds around those increments, and your projected levels tend to sit right on top of them.
What This Means For You
All of this exists to give you a target you will hold through a bounce. Here are three moves you can run on your next trade.
- Build your target from two sources before you enter. Take the projected level from the previous timeframe and the expected move from the options chain, then compare the two numbers.
- Recalculate the expected move from current price instead of the open. My morning reading was $13 from 7768 against $11 from 7753 at midday.
- Exit on broken agreement rather than on fear. The Russell closing back inside 3044 was the tell, and it arrived at the exact level both tools had named.
Take the setup when the numbers agree. Stand down when they scatter, because you have no edge worth risking capital on.
Your Next Step
Pick one market tomorrow morning. Write two numbers on a sticky note before the open.
The first is the projected target carried from the previous timeframe. The second is the expected move measured off the opening price.
Check them again at midday from wherever price actually sits. You will learn more from that one exercise than from adding another indicator.
I want to be straight with you about the outcome. The session ended before we learned whether 7742 printed, and I am not going to claim that it did.
The number still did its job. It held the bias short through every small bounce that showed up on the way down.
Read the agreement, trade the target.
Blake Young
Senior Market Strategist, TheoTRADE