Hey trader,
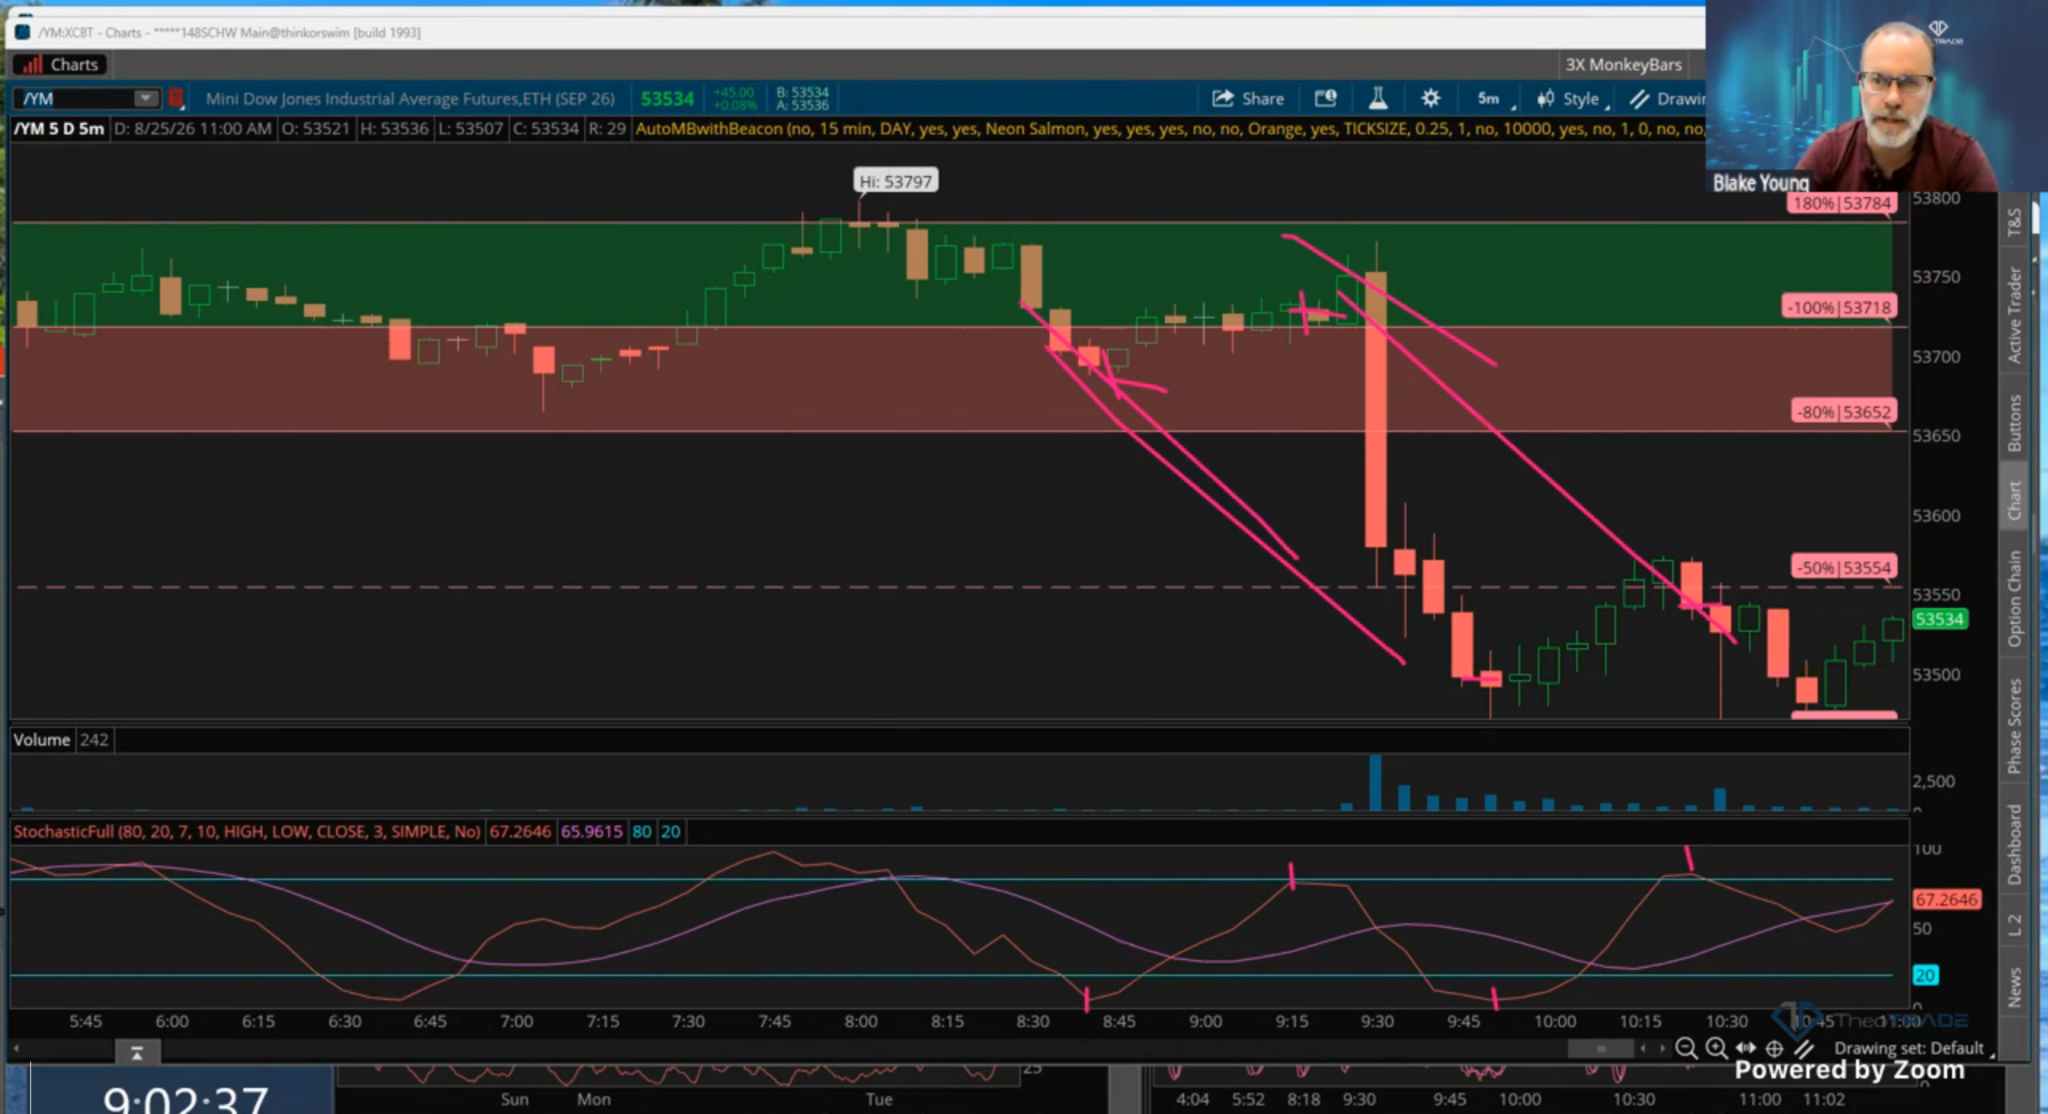
The Dow bounced Tuesday morning…price climbed back to fair price off an oversold reading…the stochastic crossed up.
Traders saw a reversal and went looking for a long.
That read was wrong.
The indicator printed a higher high while price printed a lower high.
That pattern is a hidden divergence. It warned that the downtrend still had control of the tape.
The Dow fell through 53,492 in one shot.
Buying that bounce put you 40 points underwater.
So the question is what traders get wrong about this signal.
They read every divergence as a call to fade the trend.
A hidden divergence does the opposite. It tells you to stay with the trend, and it hands you a target and a stop before the move starts.
Below, I’ll cover why the standard read fails, how to mark the signal correctly, and why it works.
Why The Standard Read Fails
A divergence means price and the oscillator disagree. That disagreement gets treated as one signal with one meaning.
The traditional version earns that reputation. It says price has gone too far and owes a correction against the current trend.
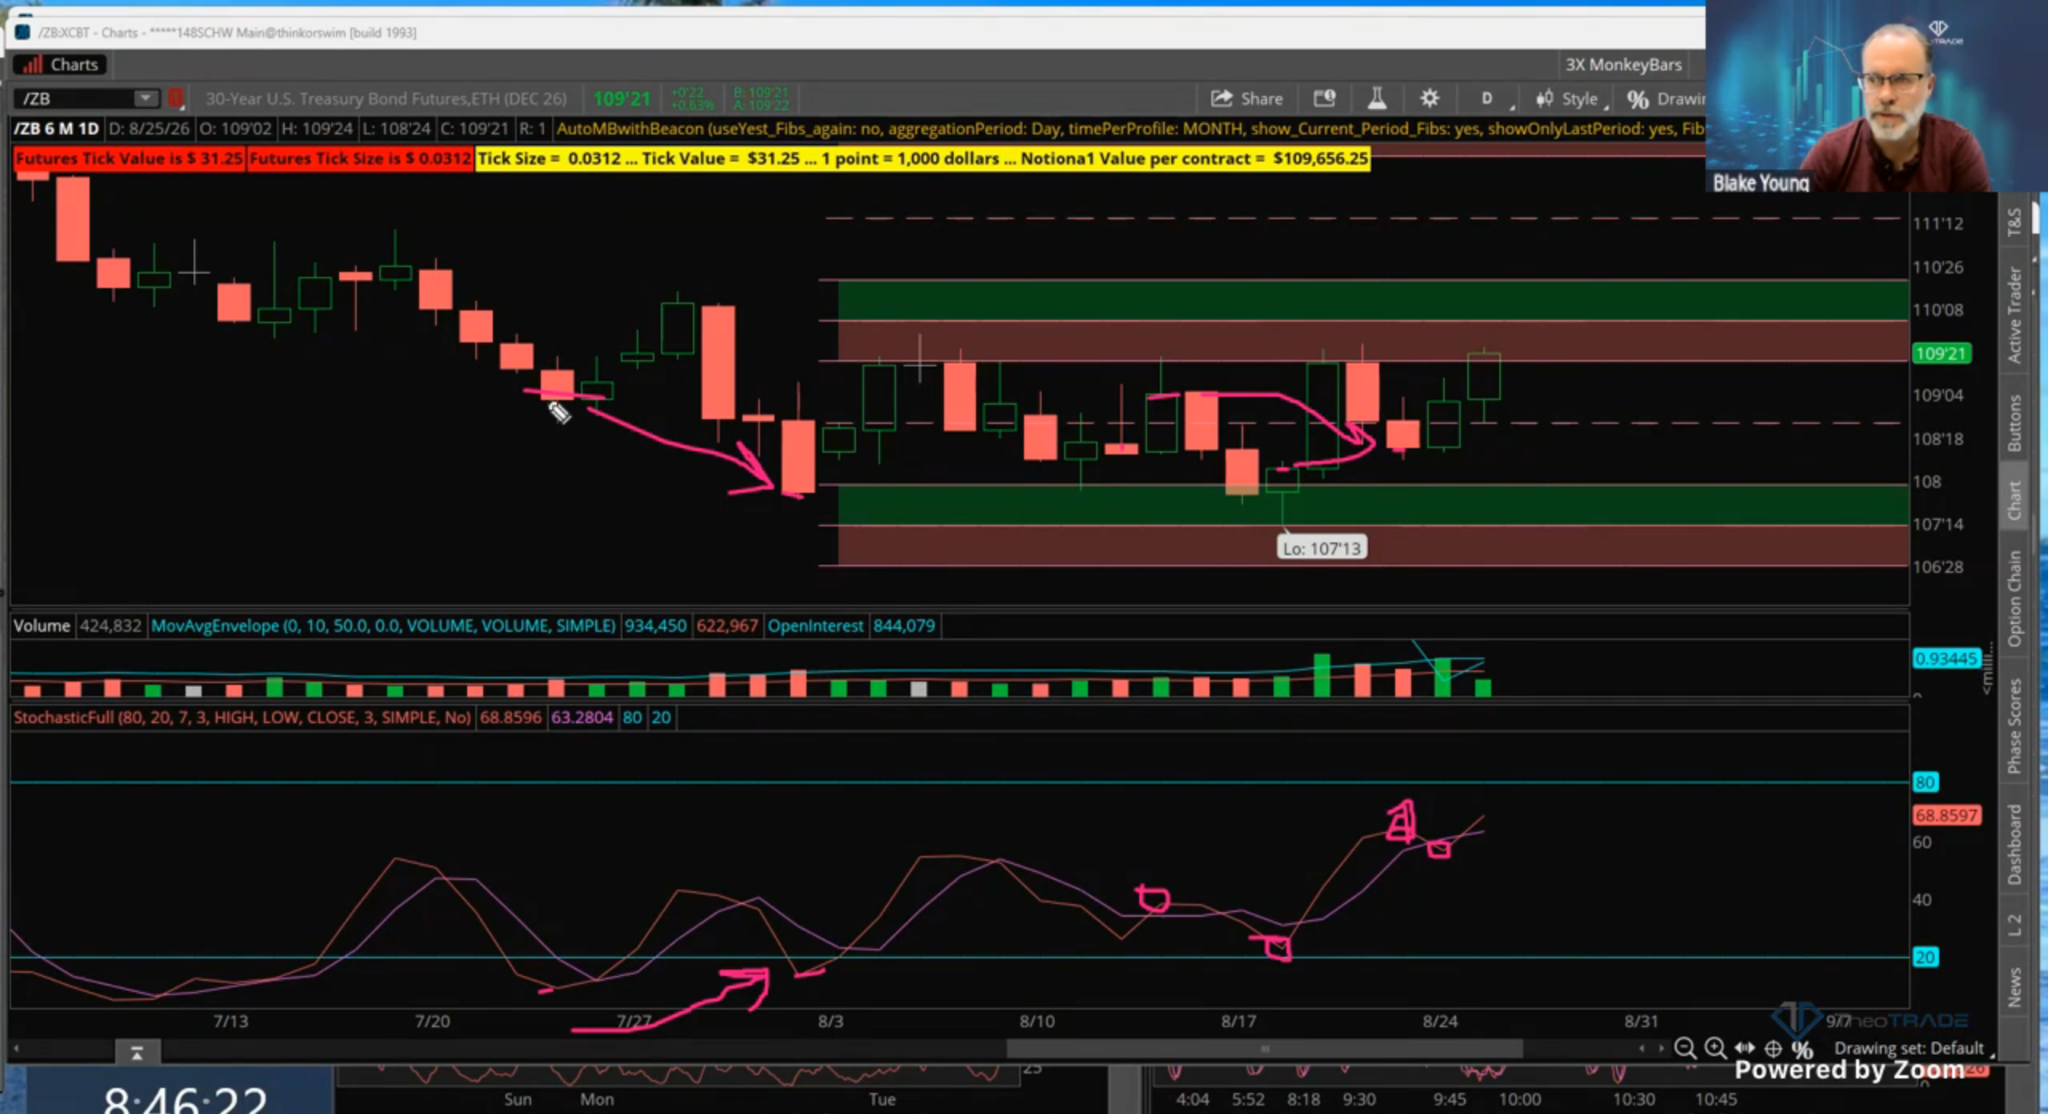
Tuesday’s bond chart gave a clean example of that.
The read called for a push up toward 110.10, and price came close without tagging it.
Hidden divergence carries the opposite instruction. The dominant trend is still in control, and the disagreement is confirming it.
That distinction costs money when you miss it.
You buy a bounce that was never a bounce.
Read The Closes, Not The Shadows
Marking the signal wrong produces a wrong answer every time. The shadows are noise on a divergence read.
I only use closing prices, and only at four specific points. Here is the sequence I ran on every chart Tuesday.
- Find the highest closing price before the indicator crossed down. That is your peak.
- Find the lowest closing price before it crossed up. That is your trough.
- Take the last four completed points, two peaks and two troughs.
- Compare price to the indicator at those four points and nowhere else.
Agreement means the trend is intact and there is no signal to trade. Disagreement is where the work starts.
Lower highs on price against higher highs on the indicator is hidden. Higher lows on price against lower lows on the indicator is also hidden.
The oscillator barely matters here. I run a 7-3-3 stochastic, which is the same as a full or slow seven.
You could use 5-5 or 10-10 or 3-3-3. I ignore the traditional cross-up and cross-down buy signals entirely.
The Dow Warned You Before Price Did
Go back to that morning bounce. Price crossed up, reached fair price, and looked like a recovery off oversold.
The indicator pushed past its prior peak value of 78. That single number confirmed a hidden divergence while the candle was still building.
The warning arrived before the high was in. I did not know that candle was the top, and I did not need to know.
The signal only claimed that the downtrend still owed a move lower. It named the destination as the closing price at 53,492.
Price traded down through 53,492 in one shot without closing below it. The close came on the next attempt, and the downtrend continued from there.
Why The Signal Pays
Hidden divergence gives you the target and the stop at the same moment. That combination is what makes the math work.
On the Dow setup, the risk was two candles on the crossover. You place the stop above that structure and let the trade run toward the named close.
Small risk against a defined target changes how often you need to be correct. A four-to-one payout means one winner in five keeps you profitable.
I hit that ratio on crude Tuesday. My risk was $57 against a $243 target.
The Crude Trade I Took Live
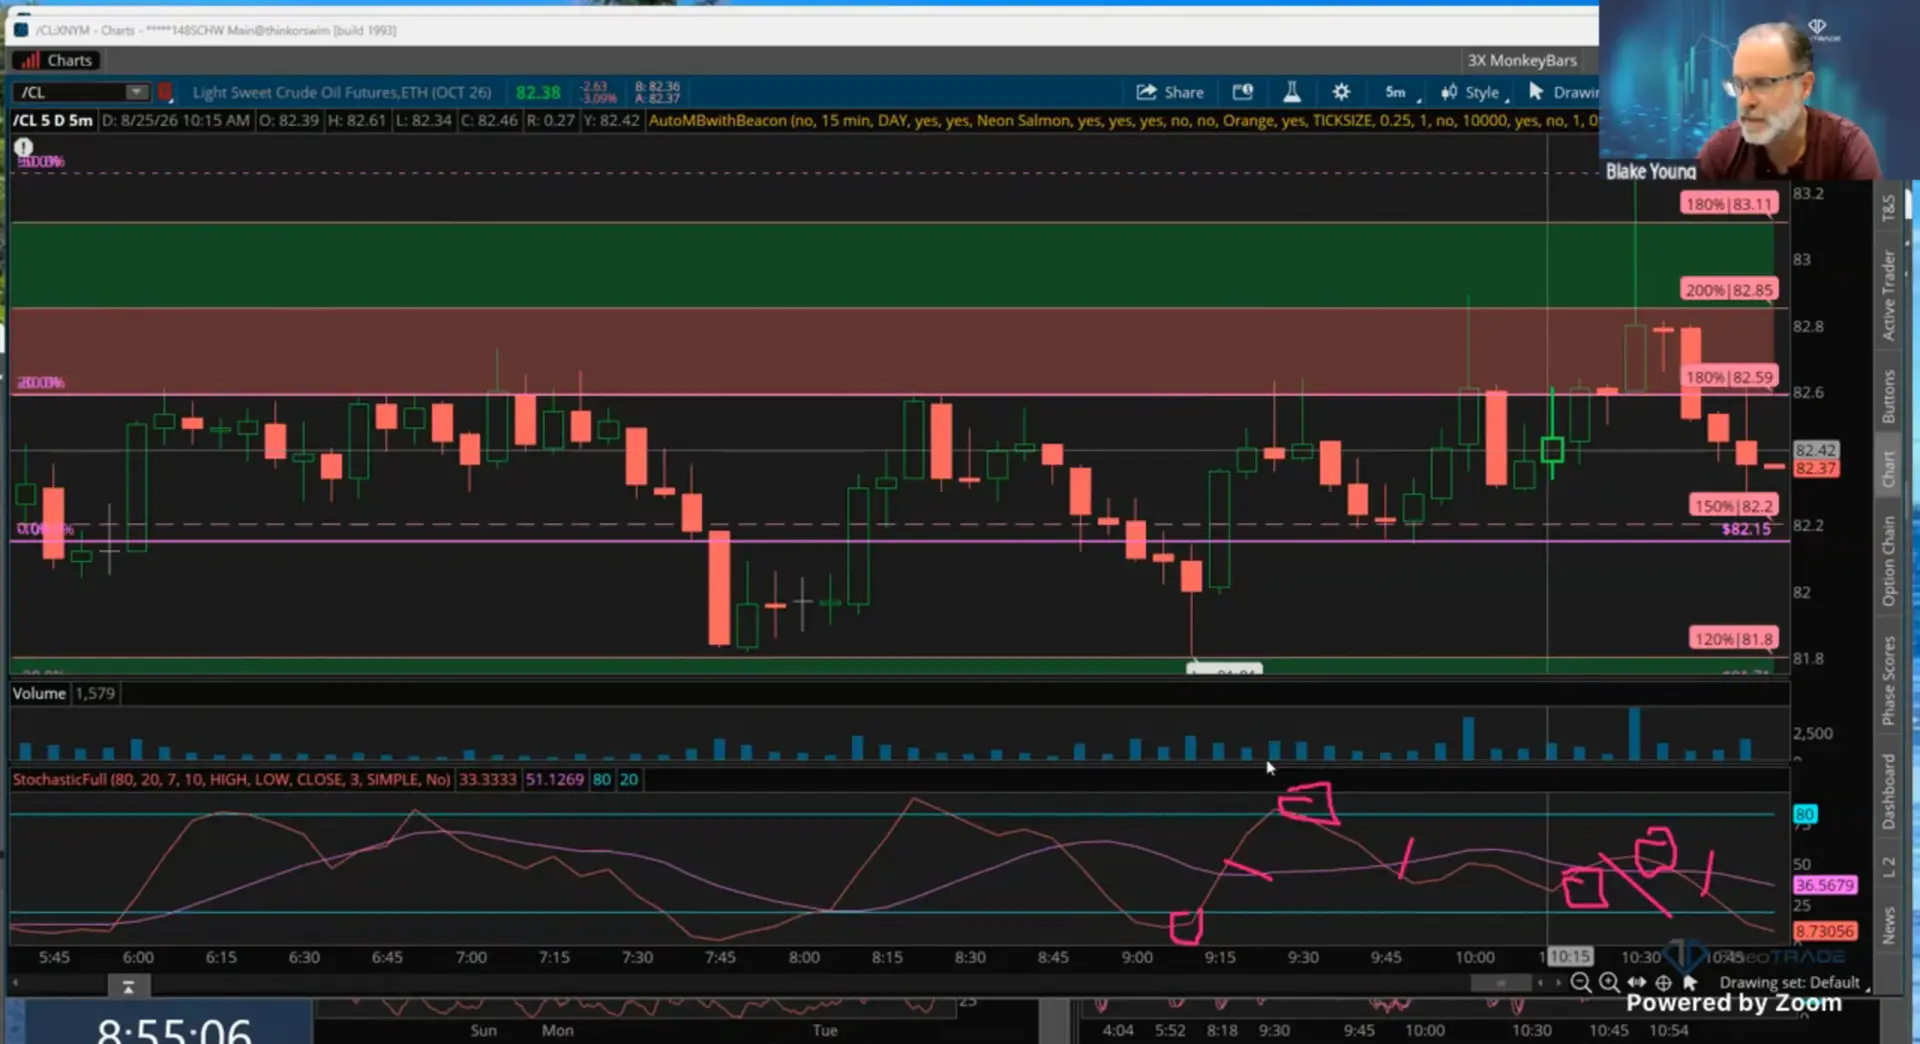
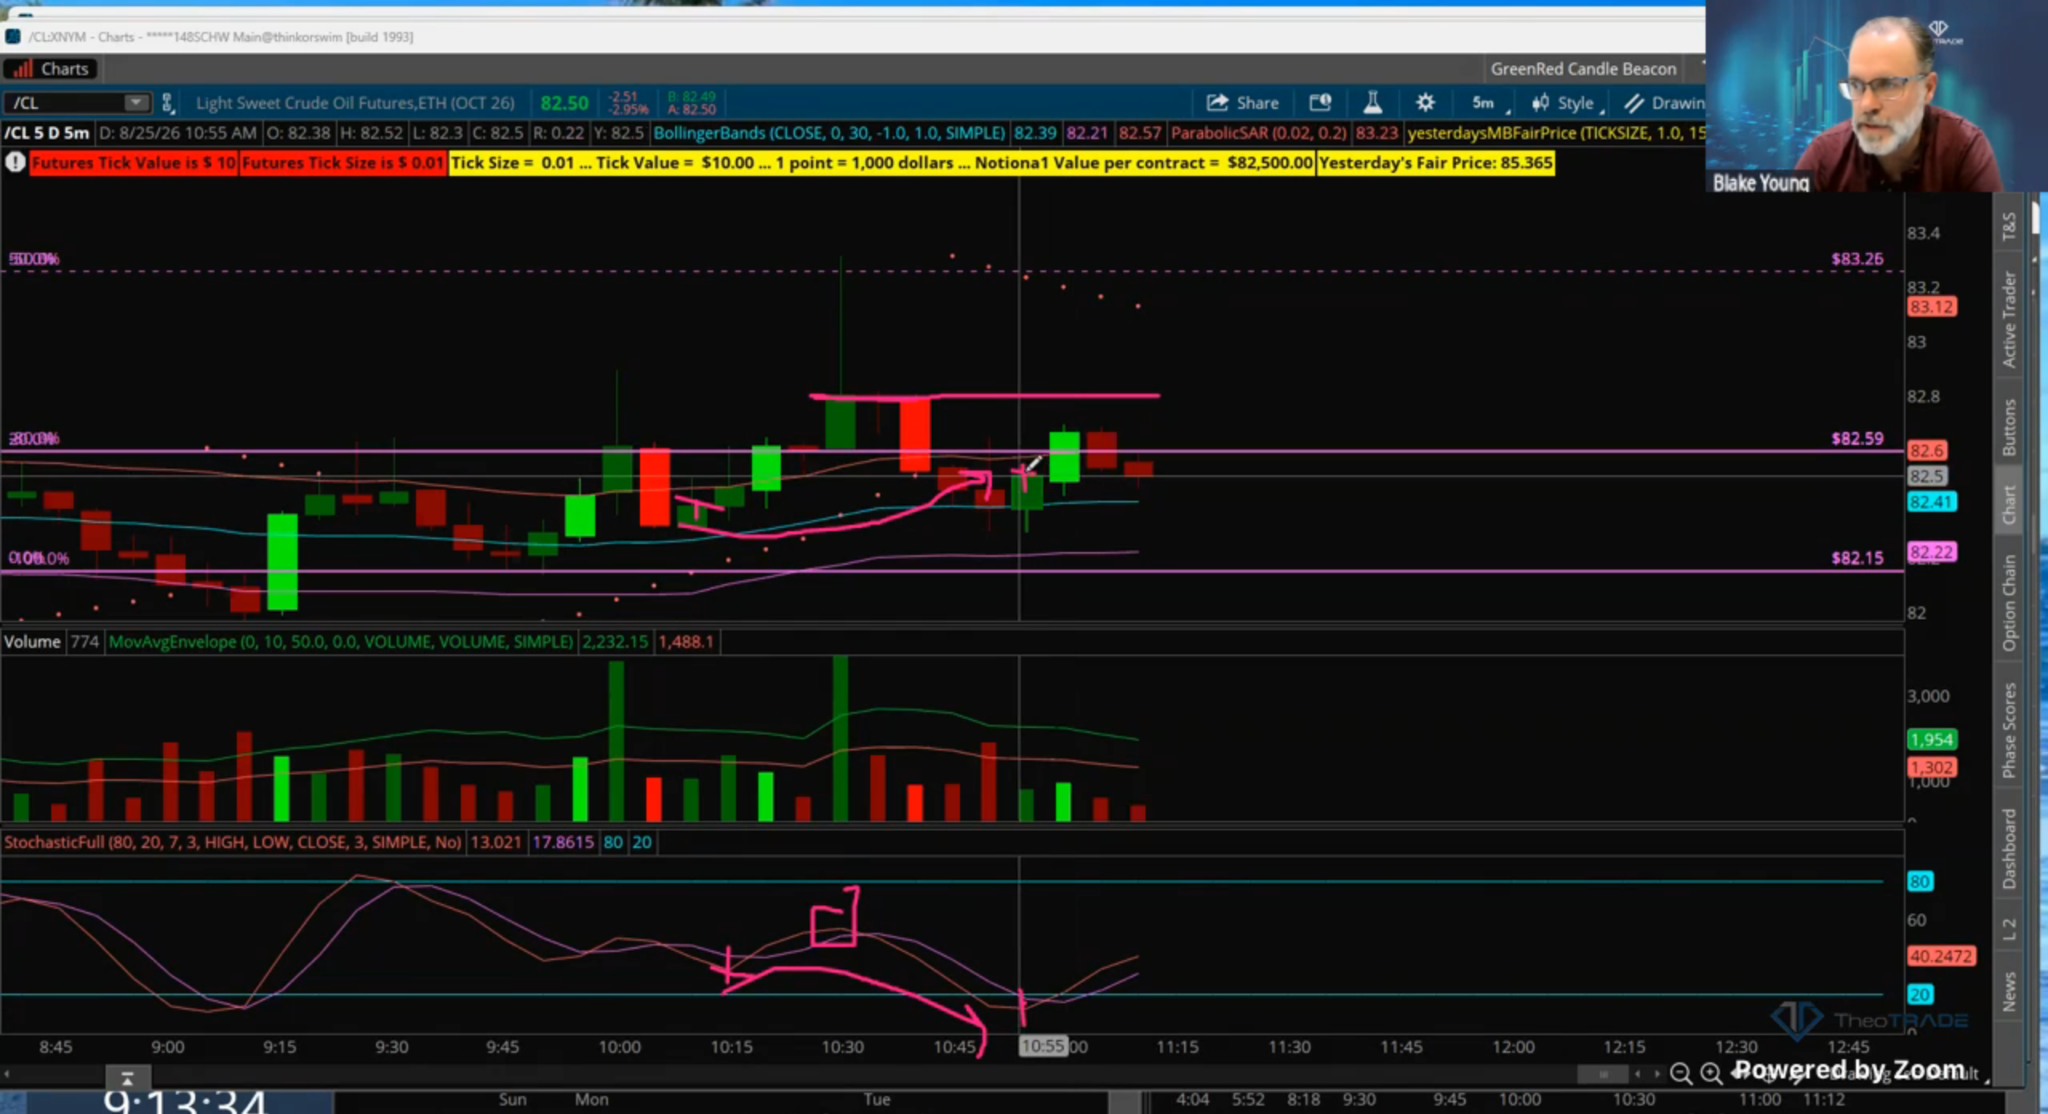
Price made a higher low on the closes while the indicator made a lower low. That is the hidden divergence, and the trend it pointed to was up.
The rule requires price to trade back through the level after the crossover. Crude did that, so I bought at $82.45.
The low of the hidden divergence sat at $82.30. I placed my stop at $82.26 and gave myself four cents of room.
Three micros put $57 at risk. My first target was the close at $82.80, with $83.26 behind it.
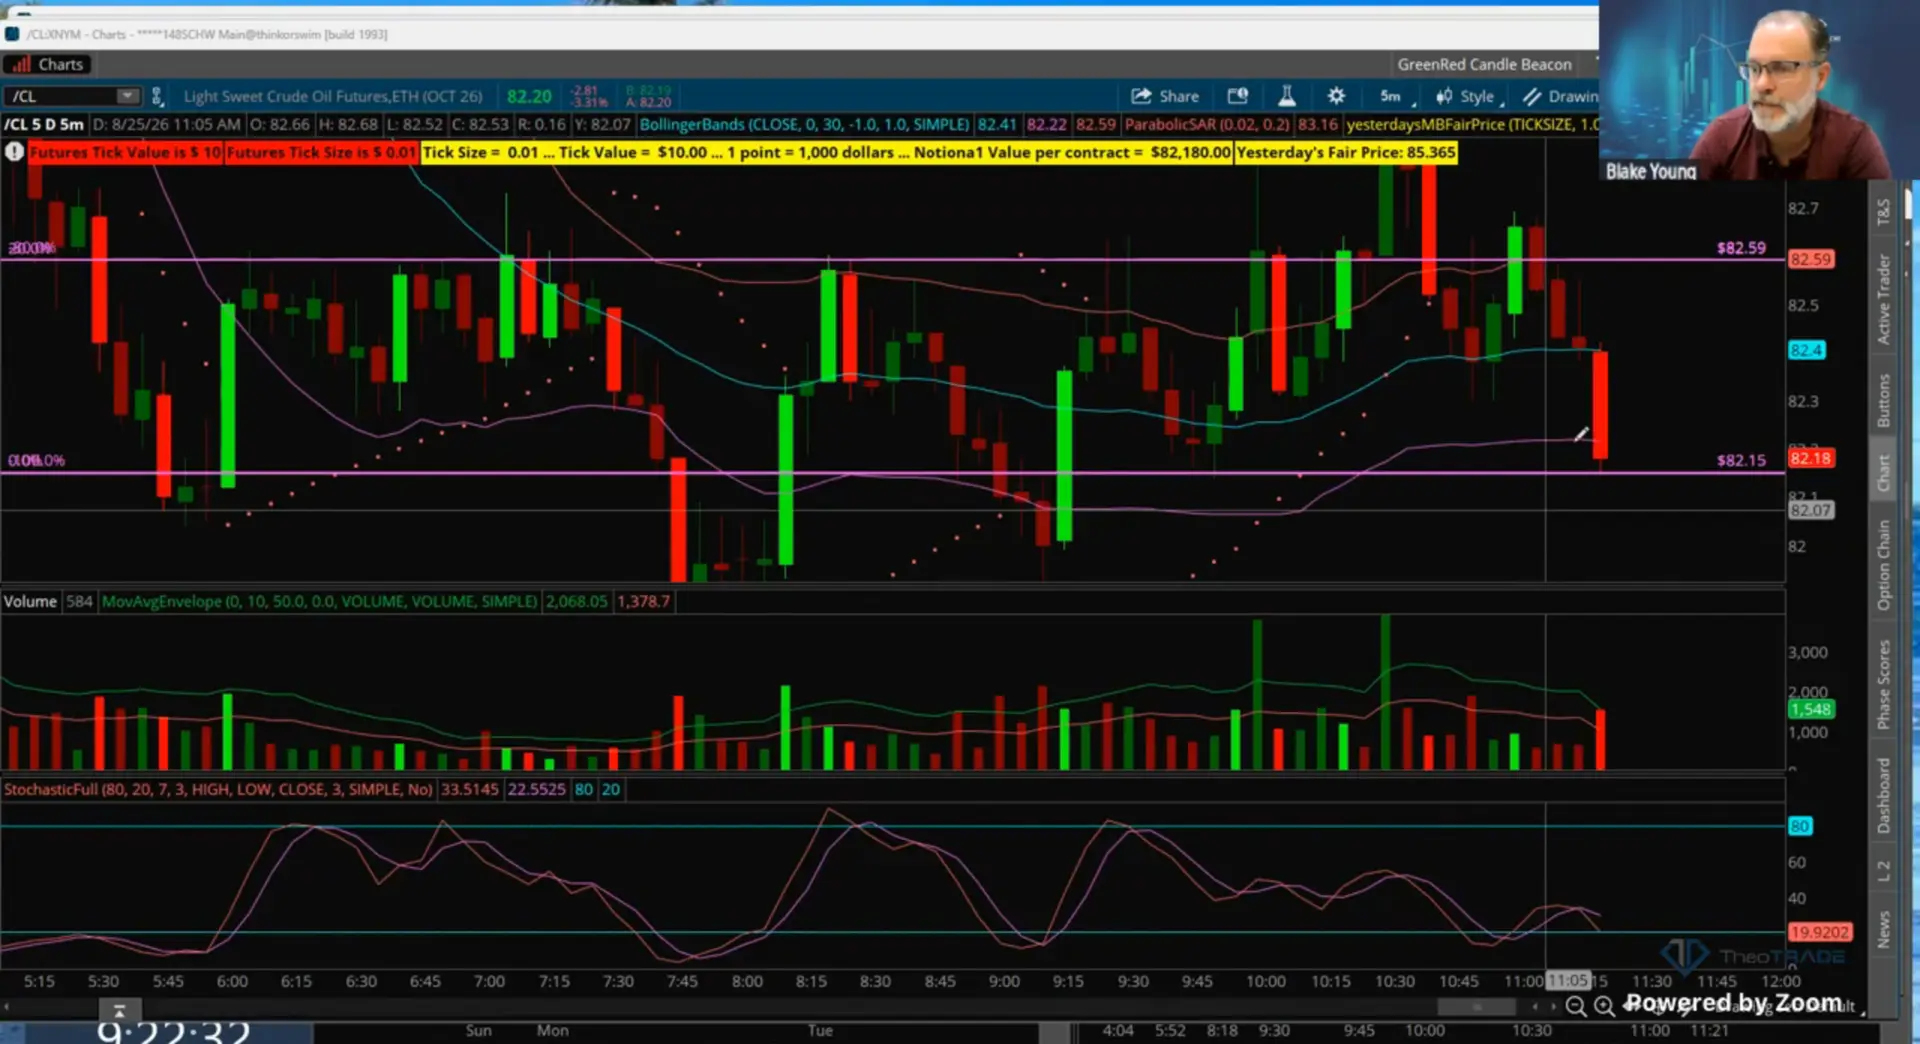
The trade did not work. Crude crossed down, cleared the low, and took me out for the $57.
I said out loud that I needed one out of five. That one was not it.
The structure held up even though the trade failed. Crude dropped to my beacon zero line at 82.15 and bounced off it to the penny.
What This Means For You
Three moves you can run on your next trade.
- Mark four points before you take any divergence trade. Two peaks, two troughs, closing prices only, and no shadows.
- Wait for price to trade back through the crossover level before you enter. That single rule keeps you out of half the bad entries.
- Write down your risk and your target in dollars before you click. If the ratio is under two to one, pass on it.
Run those three on a chart you already watch. The Netflix daily gave a textbook example Tuesday with higher highs and higher lows on both price and the indicator.
That agreement pointed to a sustained breakout with room up toward 85.80. Agreement and disagreement both tell you something once you know which one you are looking at.
Your Next Step
Pull up any five-minute chart tonight and drop a stochastic on it. Mark the last four peaks and troughs at the closes.
Ask one question of the chart. Do price and the indicator agree.
Tomorrow at 1:00 Eastern I go deeper in the master class. I’ll cover the beacon math, the risk management structure, and the XSP trades I’m adding to the system.
Join before tomorrow and you get the alerts and the levels tonight. The 30-day special is still open.
GET IN BEFORE TOMORROW’S MASTER CLASS
Small risk, defined target.
Blake Young
Senior Market Strategist, TheoTRADE