
Hey Trader,
Fundamentals are back in fashion…but not the way you think.
Taking a price-to-earnings ratio only tells one part of the story.
To get the rest, you have to compare it to the growth rate, commonly known as the PEG ratio.
Photronics was a great example this morning.
The stock failed to hold its early gains.
Why?
Because its P/E and long-term growth rate were 15. There was nothing left to push price higher.
So, naturally, when a stock’s P/E ratio sits below its growth rate, you’ve got some upside potential.
I call this concept valuation headroom. It not only tells you whether a stock has upside but how much.
Let me take you through this concept in detail so you can learn how to do this simple analysis for yourself.
The Genesis Cog Scanner flags these gaps in real time.
Valuation Headroom Explained
Valuation headroom measures the distance between what a stock costs today and what its earnings growth can justify.
The calculation needs two inputs. You need trailing earnings per share and the long-term growth rate.
Divide the share price by trailing earnings per share. That number is the multiple.
Then set the multiple beside the growth rate and read the gap. The relationship gives you one of three answers:
- A multiple below the growth rate leaves room for the price to expand.
- A multiple sitting on the growth rate leaves nothing in reserve.
- A multiple above the growth rate demands that growth accelerate to catch up.
That third reading is where accounts get destroyed. Price has already borrowed against results the company has not delivered.
Why This Matters Right Now
We’re no longer in a market where valuation doesn’t matter. It now officially matters.
The machines will recalibrate the overpriced names downward. They lift the laggards in the other direction.
I own all the lagging ones. That’s why I keep pyramiding into them every single week.
I own the stuff none of you ever touch. They’re cheap, and I don’t care what the chart looks like.
A multiple that matches the growth rate has already spent every dollar of its upside.
What It Looks Like on a Chart
The pattern shows up as a strong gap on good numbers that bleeds away all session.
Buyers pile into the opening print. Sellers meet them at the high and walk the price back down.
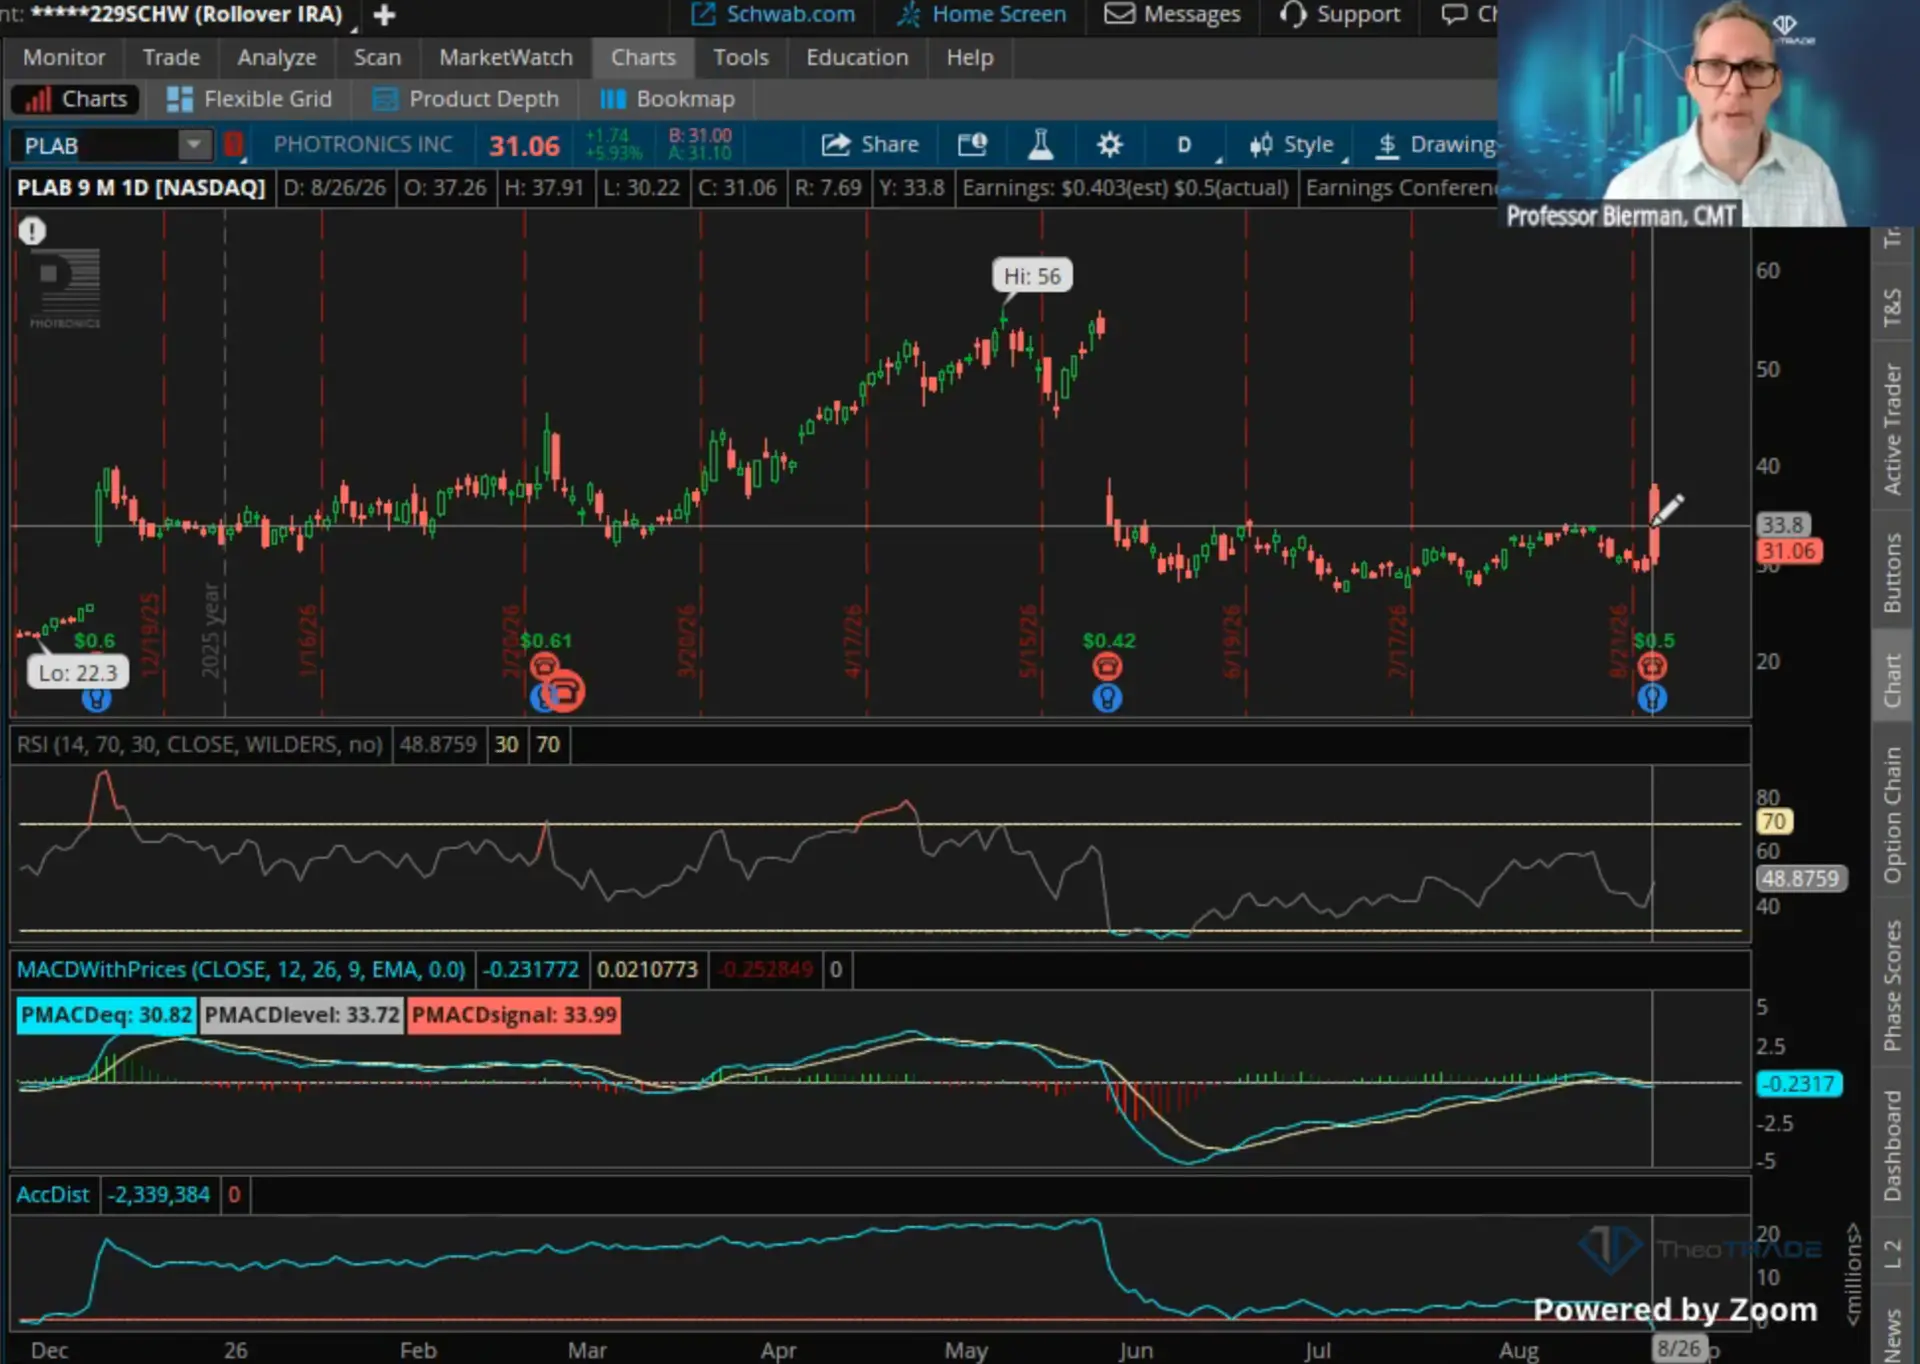
You cannot buy a stock just because it’s up and breaking. The one exception comes when it’s genuinely cheap.
Photronics Ran Out of Room
Photronics makes photomasks. They’re the largest manufacturer in the world of the masks used to build integrated circuits and flat panel displays.
It’s practically a monopoly on transferring circuit patterns onto semiconductor wafers. The business is incredible.
The company beat by 10 cents, which is awesome. The earnings weren’t bad at all.
Now run the numbers. Add up the last few quarters and you get roughly $2.00 to $2.10 in earnings.
Divide $2.10 into 31 and you land on a 15 multiple. Their long-term growth rate is 15%.
The price had already collected every point of growth the company can produce. That’s why the stock got restrained.
Their sequential earnings per share gains grow like Intel, somewhere around 8% to 12%. When Intel went from 80 down to 30, plenty of people fell in love with a chart like fools.
If you worked for me and you bought that breakout, you can consider yourself fired.
How to Use This Tomorrow
Before you buy any earnings gap, spend two minutes on the arithmetic. The process runs in three steps:
- Add the last four quarters of earnings per share.
- Divide that figure into the current share price for your multiple.
- Compare the multiple against the long-term growth rate.
The inverse setup pays you. Abercrombie guided to $13, and a 15 multiple on $13 gives you a $190 stock.
That gap between price and justified value is your headroom. It tells you how far the trade can travel before it stalls.
Charts don’t mean anything when the valuation can expand. They mean even less when it can’t.
Do the math before the trade, not after the loss.
The Genesis COG System builds this valuation work directly into every trade I take. You learn the full methodology, from the multiple to the volatility map to the exit.
Stop guessing whether a breakout has fuel behind it. Start measuring the headroom before you commit a dollar.
Get the complete Genesis COG System here.
Professor Jeffrey Bierman
Creator of the Genesis COG System