Hey Trader,
One indicator gets you nowhere. So you add a second, then a third. Maybe four indicators if you’re feeling frisky.
Counting them was never the job.
More doesn’t mean better, nor does more agreeing at the same time.
Because if you stack four momentum tools and you’ve bought one opinion four times over.
I want you to give you a new way to think about this: Treat each indicator as its own set of buyers.
Four tools measuring the same thing are the same buyers, counted four times…
…but four tools measuring DIFFERENT things give you four votes.
Votes move a stock. Opinions don’t.
Here’s the fastest way to catch yourself double-counting. The RSI and the CCI are brothers.
One adjusts for volatility and the other doesn’t. That’s the whole difference between them.
Run both and you didn’t get two votes. You got the same vote twice.
So below I’m giving you the three categories that vote separately, and the order I read them in. Each one carries a number that turns it into a yes, and you can write all three down tonight.
Then I’ll run the live count on United Airlines. Two votes are in, the third isn’t, and that’s why I haven’t bought a share of it.
The Three Groups That Vote Separately
Three categories cover everything I need, and each one answers a question the other two can’t:
- The moving average envelope and the 20 SMA measure trend and volatility
- The stochastic measures cycles, and nothing else
- The RSI or the CCI measures strength and hunts divergences
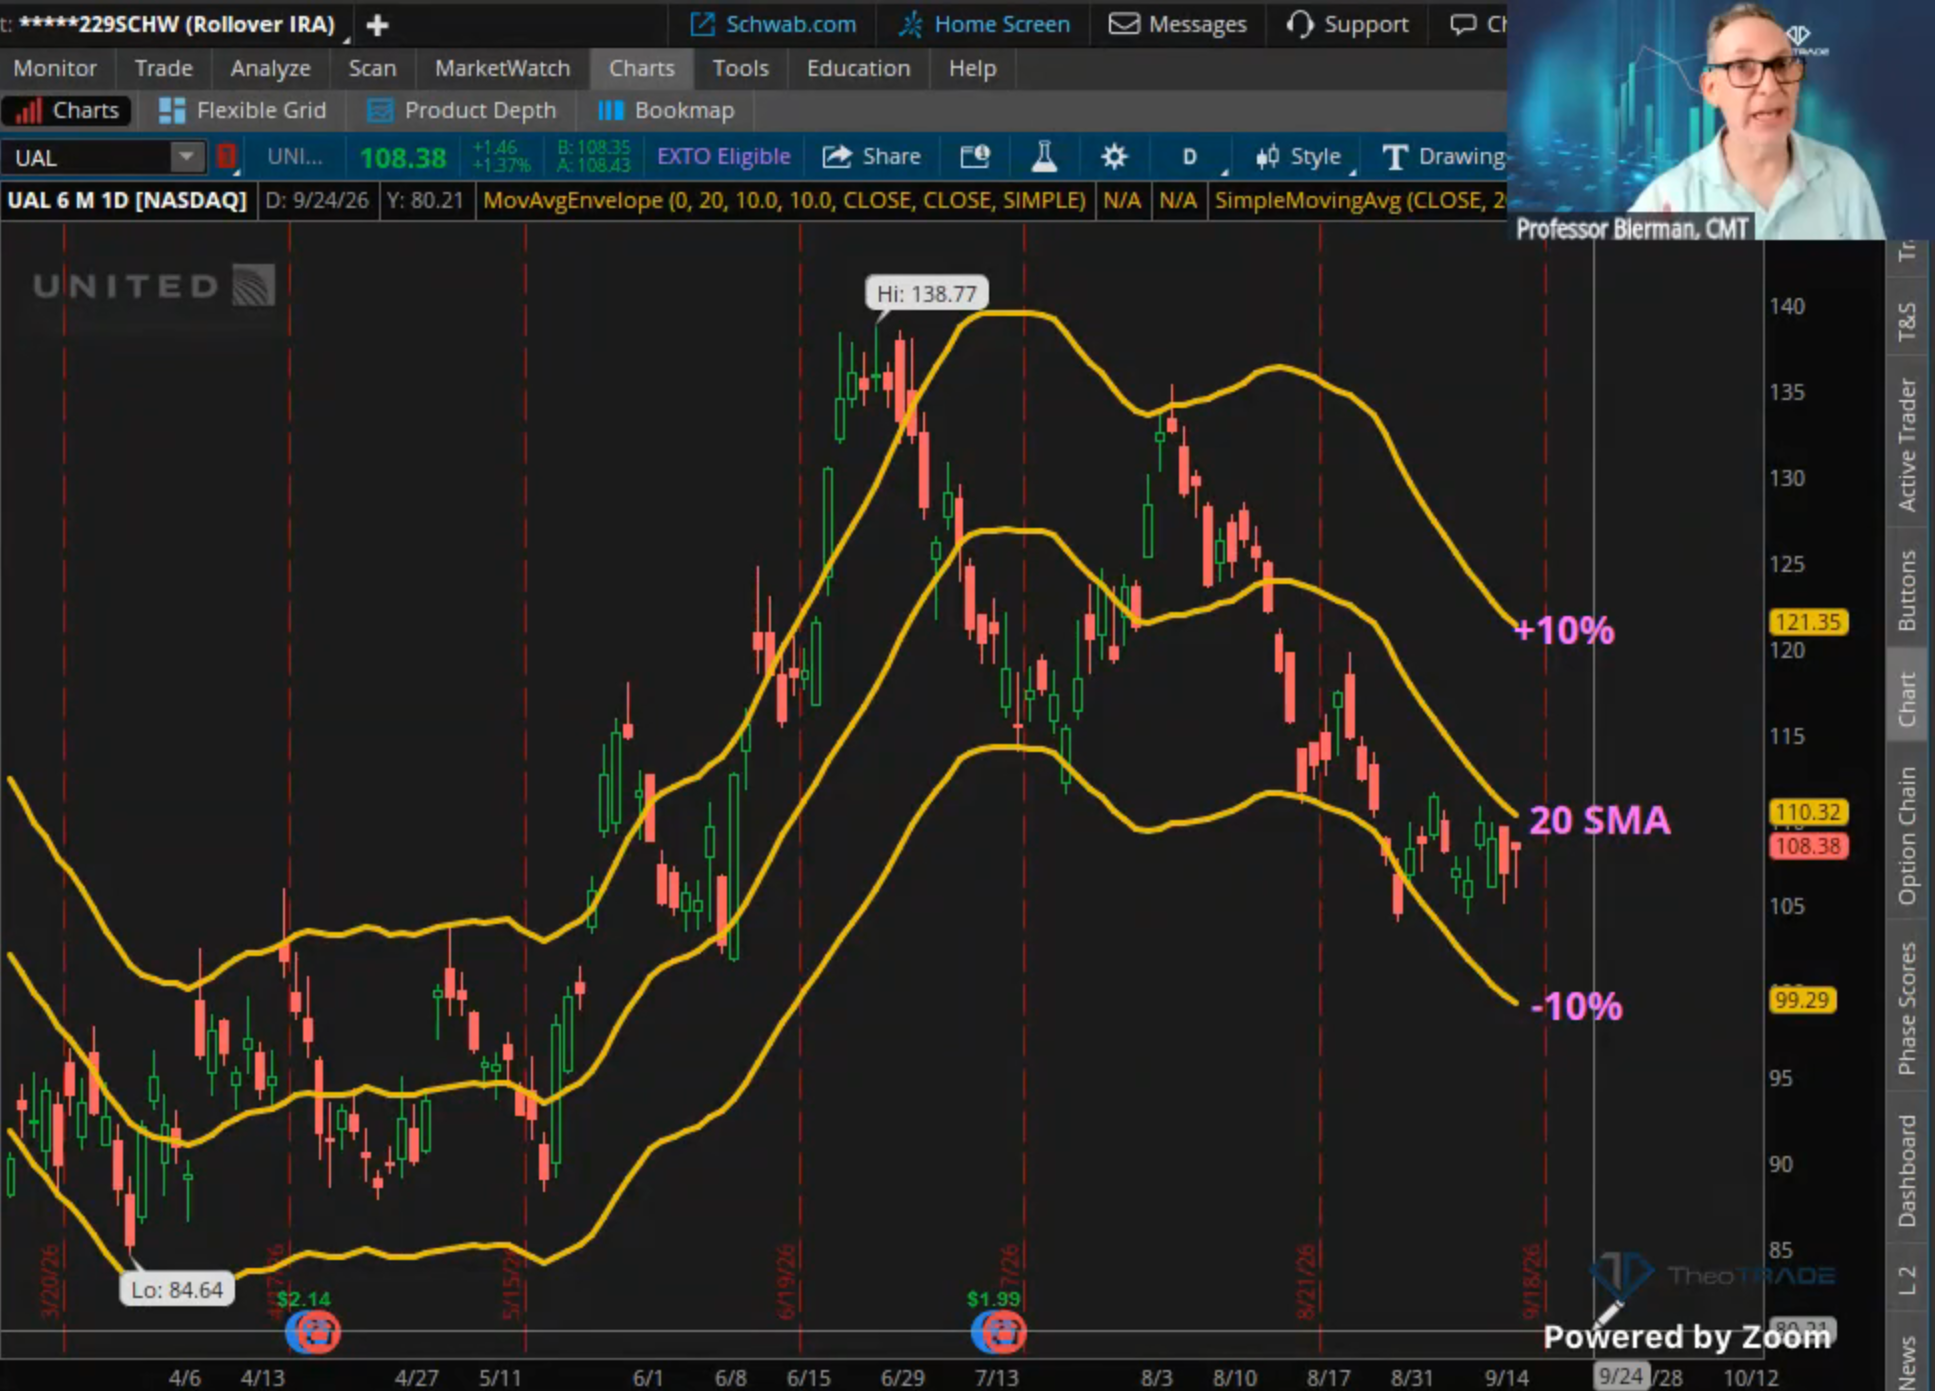
The 20 SMA is the fulcrum driving the entire show. I paint a band 10% above it and 10% below it.
That envelope adjusts to volatility in real time. A horizontal line you drew last Tuesday can’t do that.
The stochastic is not a trigger. It tells you where a stock sits in its own ebb and flow.
The RSI and the CCI do a third job entirely. They tell you whether strength is building underneath the price.
Three different questions produce three independent votes. One question asked four ways produces one.
The Votes Don’t Arrive At The Same Time
Three separate readings still leave you with a sequencing problem. I read them in the same order every session, and the slope always goes first.
Here’s why it earns that spot. A candle can flip on you inside an hour, and a headline can reverse it in a minute.
The 20 SMA can’t move that fast. It has to wait for old prices to roll off before the slope turns, and that delay makes it worth trusting.
So the slope sets the terms. Then the cycle and the strength readings come in behind it, each carrying a number:
- The percentage band flattens out
- Both stochastic lines, the K and the D, climb above 20
- The RSI breaks 45 to 50, or the CCI clears zero
Pick one strength indicator and leave the other alone. Use the RSI on a slow grindy stock and the CCI on a high-octane one.
United Airlines Is Sitting At Two Votes
Let me run that count on a live chart so you can see where a real stock stands today.
The K and the D lines crossed each other down in oversold territory a few weeks back, and people called it a bottom. The band above them was still falling at 45 degrees.
They got punked right there. One reading turned and the other two never confirmed it.
Then the K and the D crossed above 20 together on 9/10. The percentage band started to flatten behind them.
Two votes in. Support is holding at 102.50 and the range measures a clean 20 points.
The third vote hasn’t arrived. The RSI is building a base while the price grinds lower, which is exactly what I want to see.
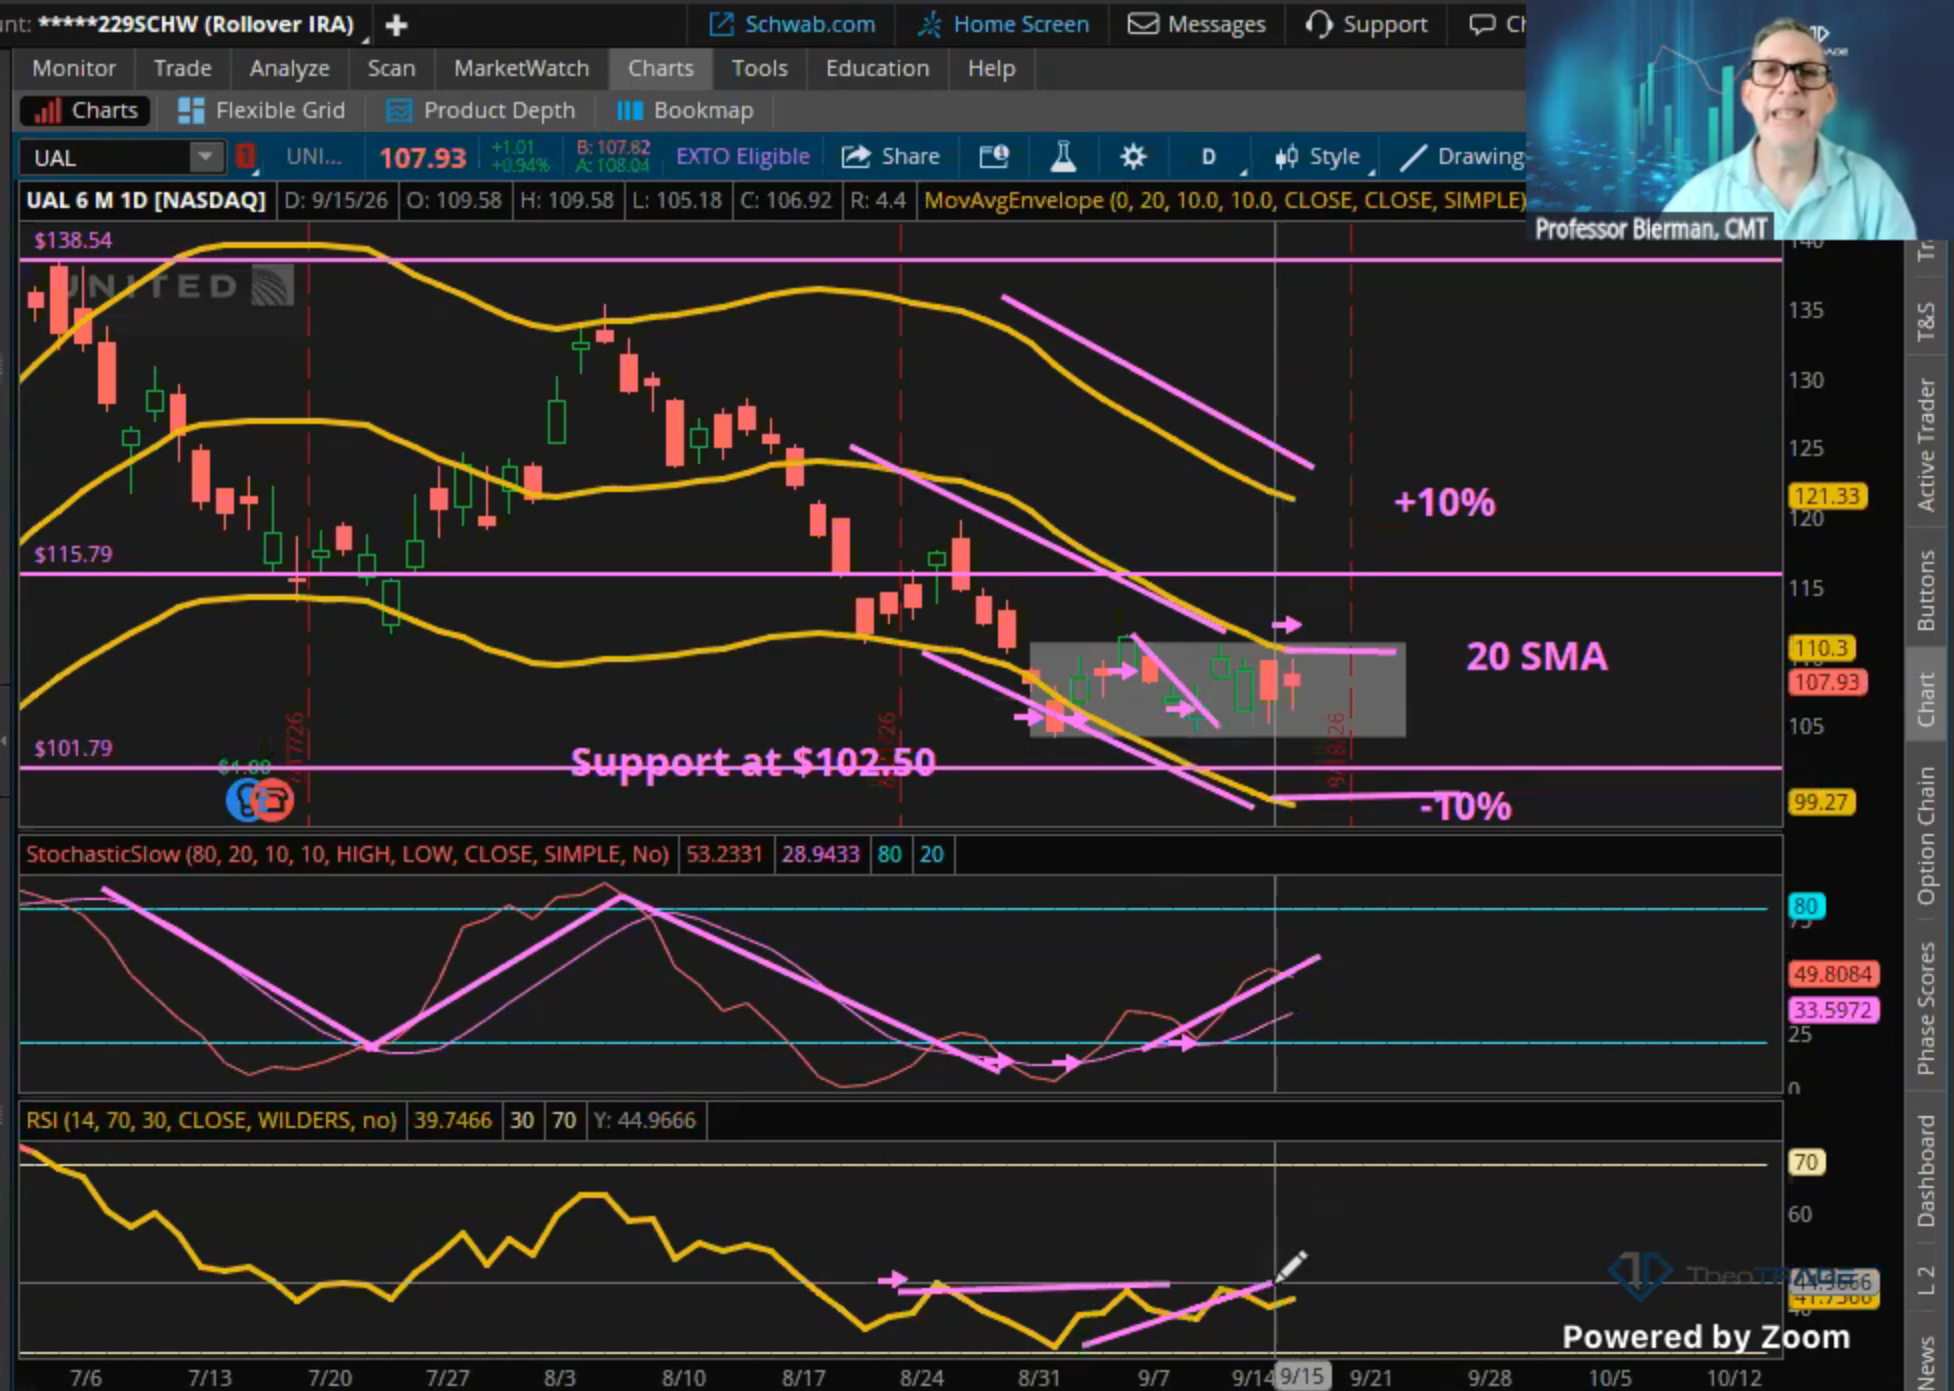
Break 45 to 50 on that RSI and the stock goes to 121. It gets there in a few hours or a few days, because it’s highly shorted with a beta 30% above the market.
I’m still not buying it today.
The fundamentals already cleared it for me. The stock trades at 10 times earnings, it bottoms at a 6 multiple, and it gets expensive at 14.
I bought it at six times earnings and sold it at 10 once before. I’m not guessing at what it’s worth.
Buying it here means buying into weakness. You’d be buying what the algorithms are selling.
How You Run This Tomorrow
Pull up anything you’re tempted to buy and sort your indicators into the three groups first. Any group holding more than one tool gets trimmed to one.
Then count the votes in order. Slope, then cycle, then strength.
Two out of three is a watch, not a trade. I’d rather give up two dollars of slippage than feel like the genius who picked the bottom.
The algorithms are waiting on the same thing you are. They pounce when institutional order flow breaks the 20 SMA and curves that line, because strength begets strength.
Alignment doesn’t forecast the move. It confirms the buyers already committed.
Running that count on one stock takes ten minutes. Running it across a 200 name watchlist every week is a different job.
That work is what the Burn Signal does. Four criteria, and when two or more align on the same name, something is about to move.
Every closed trade since July has been a winner. Fifteen in a row, and not one loser in the streak.
You get two alerts a week, each carrying a ticker, a stock trade and an options play. The Burn Room caps at 200 traders, and you get 30 days with a full refund.
Professor Jeffrey Bierman
Creator of the Genesis COG System