Hey trader,
Tesla can swing wildly, while IBM hardly moves at all. That gap makes it tricky to know when to buy or sell options on either one.
A volatility reading that looks expensive on IBM could be a bargain on Tesla. I solve that problem with IV rank.
Implied volatility is the market’s price tag on an option. It measures how much movement traders expect, and you pay for that expectation in the premium.
When that price tag runs high, I want to sell options. When it runs low, I want to buy them.
Implied volatility tends to be mean-reverting, which means it drifts back toward its average over time. The further it stretches from that average, the harder it tends to snap back.
To put that pull to work, you need to know where each stock’s own average sits.
IV rank gives you that answer. It measures today’s implied volatility against the stock’s own high and low, so Tesla and IBM each get graded on their own curve.
I pair IV rank with two numbers, 35 and 50. They tell me in seconds whether to buy or sell options, or whether to slow down and run the math.
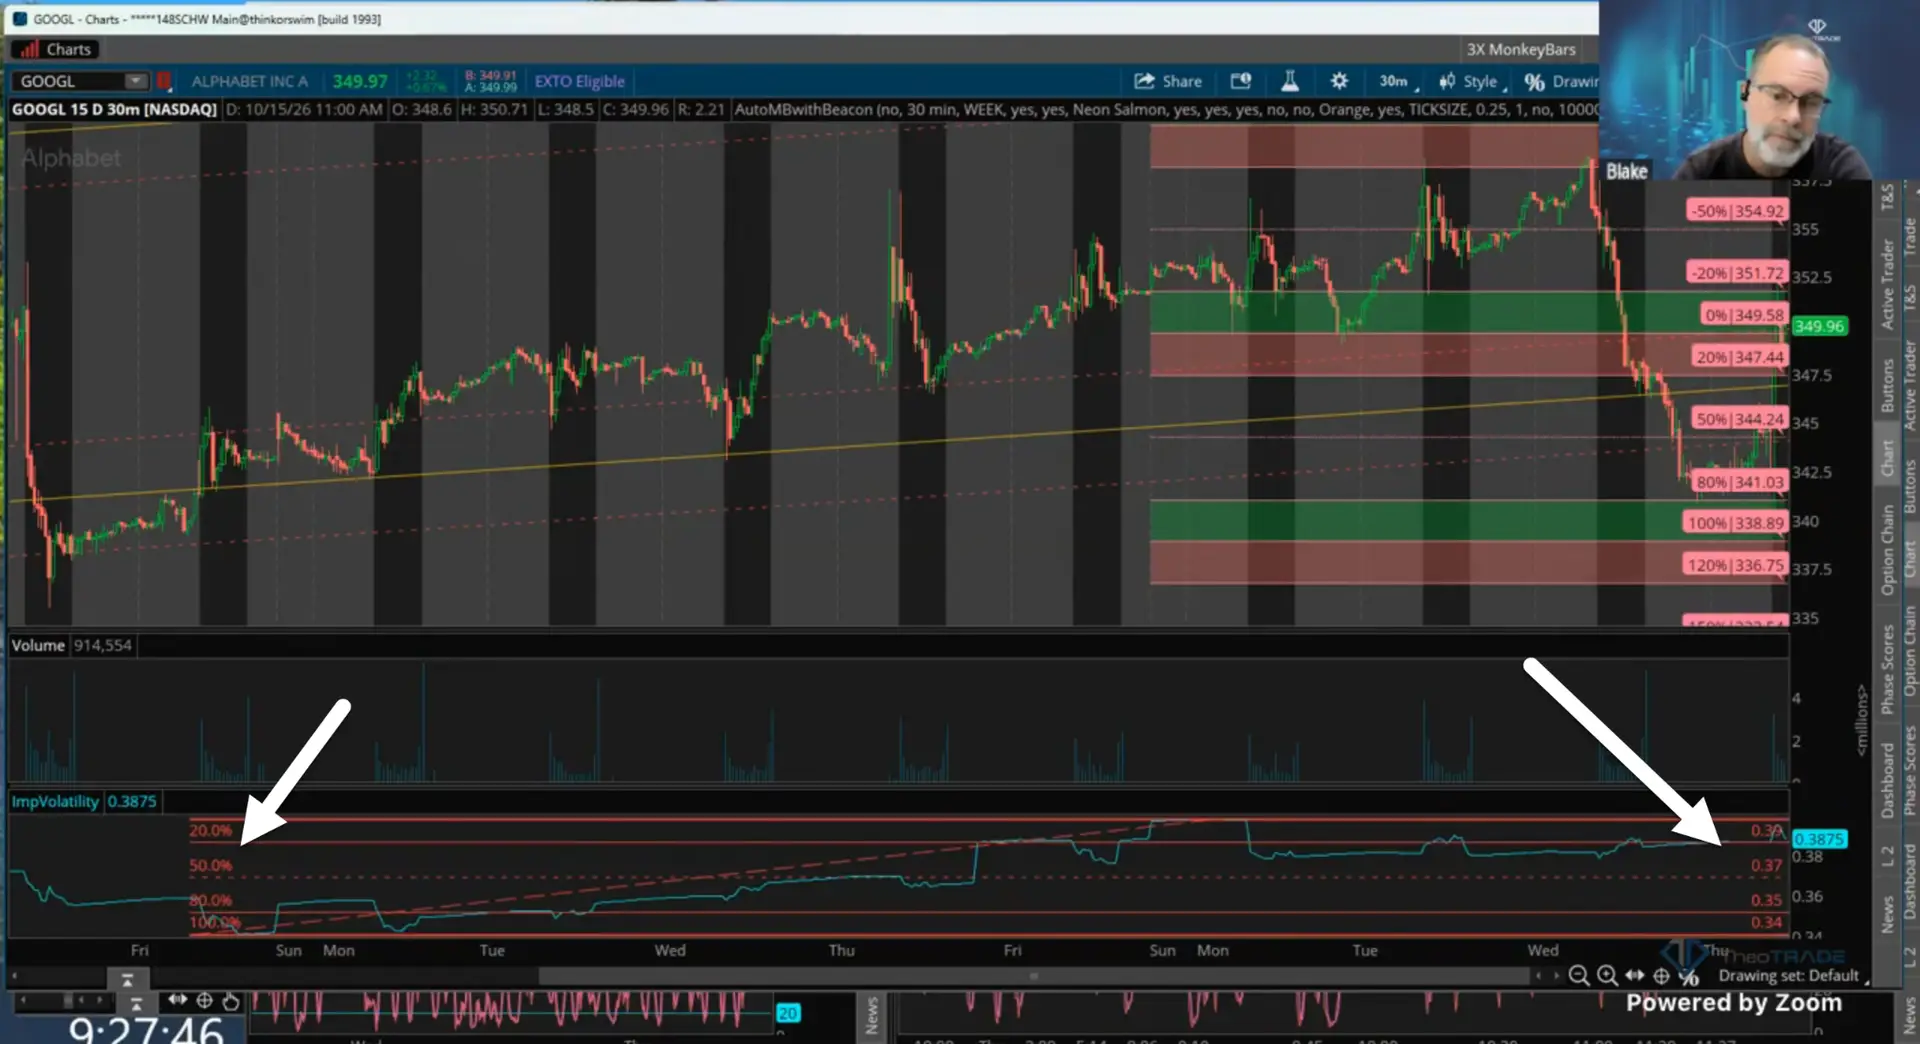
On Thursday, Google’s yearly reading landed on one of those lines. Its shorter-term readings told me which way to lean.
Before those two numbers can help you buy or sell options, you need to know how IV rank gets built. I’ll start there, then show you how Google broke the tie.
How IV Rank Works
IV rank compares a stock’s implied volatility to its own history, not to other stocks. I check it first whenever I decide whether to buy or sell options.
Start with the highest and lowest implied volatility over the past year. IV rank shows where today’s reading falls between those two points.
The year’s low ranks 0, the year’s high ranks 100, and halfway between ranks 50.
IV rank puts Tesla and IBM on the same scale. A wild stock gets measured against its own wild year, and a quiet stock against its own quiet one.
The same high-to-low math works on any window. When I say a stock sits in the 80th percentile of its three-week range, I’ve run that math over 15 days.
You can build it right on your chart. On Thursday, I added the implied volatility study to Microsoft and turned its five-day high and low into an oscillator.
My 35/50 Rule For When To Buy Or Sell Options
I use the yearly IV rank to decide whether to buy or sell options. My rule of thumb comes down to three bands, and each one leans on mean reversion:
- Below 35. Implied volatility sits low and has room to rise toward average, so I want to be a buyer.
- From 35 to 50. The reading sits near normal, so I treat it as neutral and run the numbers.
- Above 50. Implied volatility sits high and has room to fall back, so I want to be a seller of premium.
Below 35, I buy options. Above 50, I sell them.
That’s my line, and it doesn’t have to be yours.
For short-term trades, I dial the same idea in with the day, the week and the past three weeks.
A falling reading can still be expensive. On Thursday, ES implied volatility kept fading as price climbed.
Even after fading, it sat above the peak it reached during Wednesday’s selloff. I told the room, “Even though it’s fading right now, it is not inexpensive.”
The rule cuts the other way too. Later Thursday, XSP implied volatility ran relatively low for the day on a bearish signal.
I bought the 771 put at 81 cents, and it filled instantly. I never reported a result on that put before the session ended, so I won’t claim one.
How Google Broke The Tie
Google gave me the tricky case. Its yearly reading sat at 50%, right at the edge of my neutral band.
That number includes earnings and the past year’s chaos. The shorter windows settled it.
On the one-week view, the low came from the prior Thursday and the high from the overnight session. With price near the highs, the premium still looked overvalued.
The three-week view made the case. Google’s implied volatility sat in the 80th percentile of that 15-day range.
I told the room to be a seller of premium there. You don’t want to be a plain long call or long put buyer when the market charges that much.
High implied volatility tells you whether to buy or sell options. It doesn’t promise that a given trade pays enough.
I priced a one-day Google short call vertical, $2.50 wide, for about 75 cents. As I told the room, none of my math is easy.
That price meant I needed to be right 70% of the time. The premium wasn’t there to support it, so I passed.
Run This Check Before You Buy Or Sell Options
You can run it on your next trade in three steps:
- Pull the yearly IV rank. Below 35 points you toward buying, and above 50 points you toward selling.
- Break ties with shorter windows. Mark the high and low for the week and the past three weeks, then see where today sits.
- Run the numbers before you sell. High implied volatility picks your side, but the premium still has to pay you enough.
Let IV rank tell you whether to buy or sell options before you pick a strike.
I told the room on Thursday that I’m looking for even an extra 1% or 2% edge. Checking IV rank before you buy or sell options takes seconds.
I ran this check live in the 10% Club on Thursday before calling an XSP trade. Implied volatility sat about 50% higher than normal for that time of day.
A call near the 30 delta cost $1.06. I used a 771/772 call spread instead and paid 33 to 34 cents.
I closed it at 66 cents, a 100% return. Past results are not a promise of future results.
Inside the 10% Club, you hear the volatility read behind every call. You also get the entry, stop and target first, plus every stop change in the chat.
Check where implied volatility ranks, then decide whether to buy or sell options.
Blake Young
Senior Market Strategist, TheoTRADE