Hey Trader,
Back in the 1950s, a ballroom dancer named Nicholas Darvas taught himself to trade.
During rehearsals, he’d pull out a piece of paper and draw squares around a stock’s price. He was hunting for staircases.
Those squares became the Darvas box strategy. Each box maps where a stock has been consolidating, with a ceiling on top and a floor below.
Darvas only traded when price broke out of that box. Once the stock started stalling into its next box, he got out.
His logic was simple. Don’t fight the tape. Look for the break.
I’m going to walk you through how he traded the Darvas box strategy. Once you see it, you’ll know when to get in and when to get out.
I find selling the hardest call in any trade. The box gives you a rule for it.
It also keeps you out of the middle, where the machines push prices around all day. Fight them, and they’ll eat you alive.
Years ago, a client asked me to get the Darvas box built for the brokerage I worked at. The programmers took three months to do it.
I draw my own boxes by hand with a rectangle tool. The Darvas box draws them for you, using the same breakout logic I trade.
Darvas and I make our money at the edges. That’s where the risk is lowest and the return is highest.
Grab a chart you’re watching and follow along. We’ll start with how the box gets drawn.
Click Here to Continue Reading
P.S. One chart lesson sits behind 38 winners in my last 48 trades.
I call it the lonely candle. It shows up on stocks Wall Street forgot, before the crowd arrives.
Tomorrow, October 22 at 1 PM ET, I’m teaching it free and live. I’ll show you all 10 losers and the forgotten stock I’m watching right now.
A hypothetical $2,000 model account taking one options contract per trade grew to $4,907.* Register, and my Lonely Candle Checklist lands in your inbox right away.
There’s no replay. One live attendee also wins $1,000 cash.
👉 Save My Seat for The Lonely Candle
How To Set Up The Darvas Box Strategy
Drawing channels is like an Etch A Sketch to me. If you’re good at it, you have an edge you can’t imagine in this business.
The Darvas box strategy starts the same way. Find a stretch where the stock stalls and trades sideways.
Draw a rectangle across the highs of that consolidation. That line is resistance.
Then run the bottom of the rectangle along the lows. That line is support.
Darvas plotted these squares looking for staircases. Each breakout stacks a new box above the old one.
When a stock breaks out, the old resistance becomes new support. A new box starts forming from there.
Some charting software will plot the box for you, with arrows on each break. That version just mimics the Darvas box strategy, so the trading doesn’t change.
If you also use a price channel, pick one. When one says buy while the other says sell, you’re stuck doing nothing.
Where The Darvas Box Strategy Gets You In
The Darvas box strategy has one entry rule. Darvas bought the breakout or shorted the breakdown.
He didn’t wait for a moving average cross or anything else. Stop with your overthinking.
Inside the box, Darvas wouldn’t take the trade. Once price broke out, he took it 100 times out of 100.
I understand why. I can’t read the algos in between the channels, but I can read them at the edges.
He made his money at those edges. He let the breakout tell him which way the stock wanted to go.
3M shows the Darvas box strategy at work. When the stock broke above its box, the breakout gave a buy at 168.65.
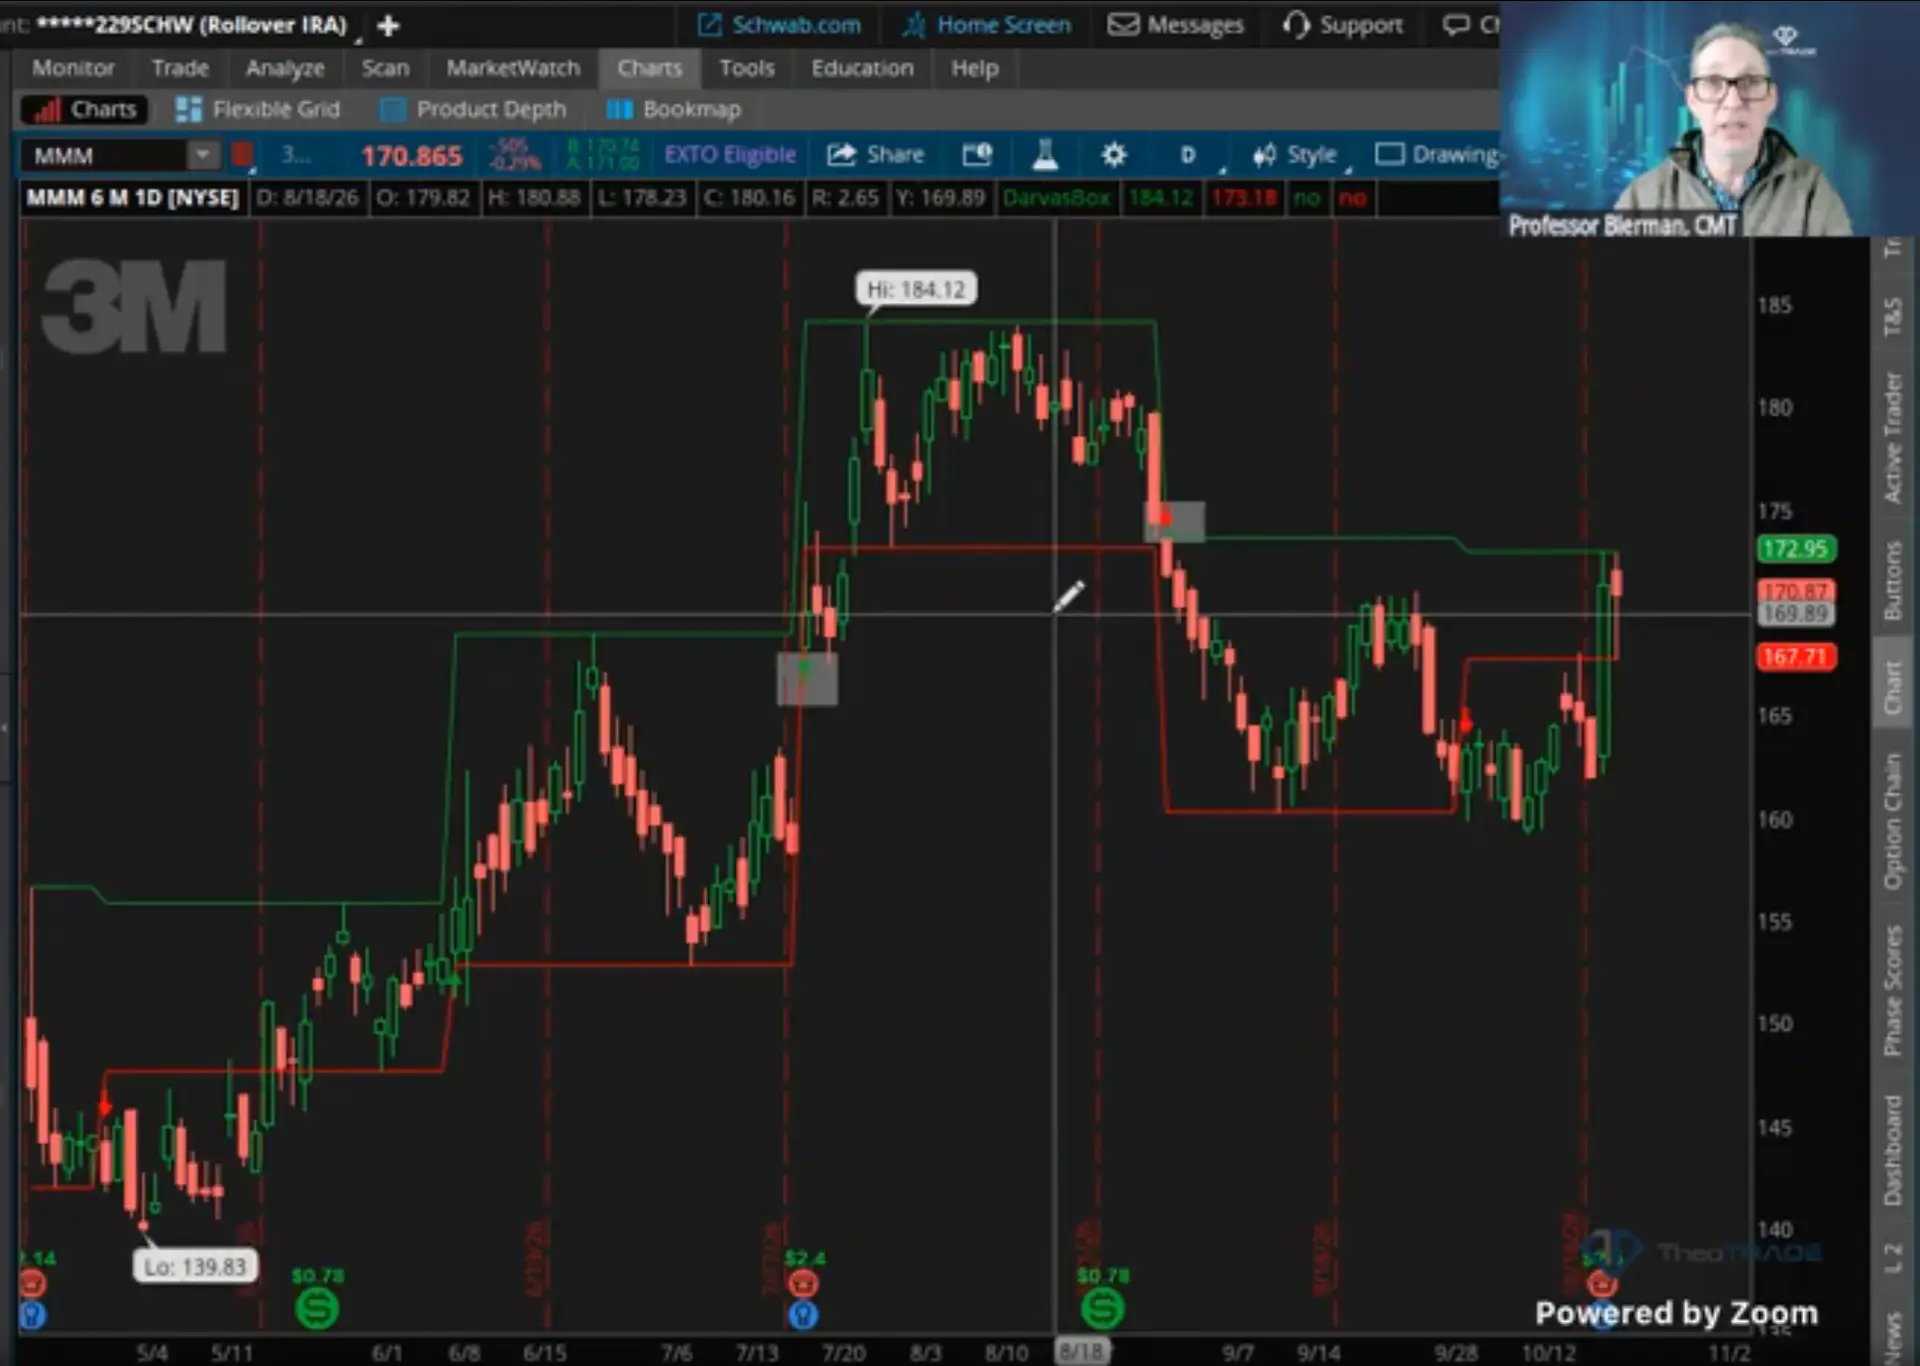
The rule works on the short side too. When 3M later broke below its box at 172, Darvas would have taken the short.
How Darvas Knew When To Sell
Once you’re in, you have to decide when to get out. You can sell any time you want, or you can wait for the next sell signal.
Darvas did neither. He waited for the stock to stall in its next box.
Then he counted a set number of days of consolidation. Once that count was up, he was out.
On the 3M breakout, that count was about 10 days. He’d likely have sold around 182, roughly $13 a share above his entry.
On the 3M short, the stock consolidated for about five days. Darvas would have covered around 160.
He watched for a double top too. Price would run up to the top of the new box and back off.
If it came back for a second pass at that same level, he bailed. He didn’t wait around for a third try.
You use the flat to exit. You use the breakout to enter.
How To Put The Box To Work
I wouldn’t trade the Darvas box strategy alone. I want money flow, momentum and strength backing up every trigger.
If those confirm the break, I’d take the trade. Before you trade the Darvas box strategy on your next chart, run these four checks:
- Draw the box first. Mark the consolidation highs as resistance and the lows as support.
- Wait for the break. Inside the box, you do nothing.
- Confirm the trigger. Check money flow, momentum and volume before you commit.
- Plan your exit up front. Sell once the stock stalls in its next box.
The box also keeps you on the right side of the market. Right now, the E-mini shows no threat to the bottom of its box.
Shorting here means fighting the box. You short breakdowns, and you buy breakouts.
If you’re going to fight the machines, you won’t make money in this business.
Channels freeze-frame everything for me. They show me the risk before I ever put on a trade.
My own method gets me in earlier than Darvas did. In the Genesis COG account, I bought a stock at 57 when it broke a downward channel.
I’d already mapped the next resistance at 64.50. When it got there, I sent an alert telling everyone to sell, and we all got out.
That’s the same edge behind the Darvas box strategy. I just get in earlier and plan my exit before the buy.
The Genesis COG System gives you the complete methodology behind trades like that one. You’ll learn to map resistance before you ever put money in.
The Genesis Cog Scanner adds real-time signals on top. Together, they keep you trading the edges instead of the middle.
Join the Genesis COG System Today
Professor Jeffrey Bierman
Creator of the Genesis COG System