Every options chain is telling you something before you place a single trade: how far the market thinks the stock is going to move. That number is the expected move, and it’s the first thing I look at on every trade I put on. I’m Don Kaufman. I spent years pricing options as a market maker and teaching them at thinkorswim, and if I could get every retail trader to learn one concept, this would be it. Once you know the expected move, you stop guessing and start pricing.
What is the expected move?
The expected move is the price range the options market is pricing for a stock, ETF or index over a set period of time: through Friday, through earnings, or through a specific expiration.
It comes straight out of option prices. When traders pay up for options, the implied volatility rises and the expected move gets wider. When options get cheap, it narrows. So the expected move is not my opinion or yours. It’s the market’s consensus, with money behind it.
Two things it is not:
- It is not a direction. The expected move is the same distance up and down. The market is pricing how far, not which way.
- It is not a guarantee. Stocks finish outside the expected move all the time. What the expected move gives you is a probability-weighted range you can build trades around.
How to calculate the expected move
There are two ways to get the number. Both come from the same option prices, so they land in the same neighborhood.
Method 1: The at-the-money straddle
Add the price of the at-the-money call and the at-the-money put for the expiration you care about. That’s the straddle price, and it is the market’s quick estimate of how far the stock will move by that date.
If a stock is at $200 and the 30-day at-the-money straddle costs $14.65, the market is roughly pricing a $14.65 move in either direction. This is the fastest method, and it’s the one I use in real time, because it only takes two quotes.
Method 2: The implied volatility formula
If you want the one-standard-deviation range, use this formula:
Expected move = Stock price × Implied volatility × √(Days to expiration ÷ 365)
Same $200 stock, 30 days out, implied volatility of 32%:
- $200 × 0.32 = $64
- √(30 ÷ 365) = 0.287
- $64 × 0.287 = about $18.35
That gives you a one-standard-deviation range of roughly $181.65 to $218.35. In theory, the stock finishes inside that range about 68% of the time.
Why the two numbers differ: the straddle is closer to the average move, and the formula gives you the one standard deviation move. The one-standard-deviation move is about 1.25 times the straddle. Don’t let that confuse you. Pick one method and use it consistently so you’re always comparing like with like.
(The numbers above are an illustration, not a trade recommendation.)
What the expected move tells you and what it doesn’t
The expected move is the market’s best guess. That makes it useful in two ways.
First, it tells you what “normal” looks like. If the expected move through Friday is $8 and the stock moves $3, nothing happened. If it moves $15, something did. A lot of traders react to every tick. The expected move tells you which ticks matter.
Second, it tells you what you’re paying for. When you buy options, you need the stock to move more than the expected move to come out ahead, because the expected move is already baked into the price. When you sell options, you’re betting the stock moves less. Either way, you’re trading against the expected move, whether you know it or not.
What it doesn’t tell you is when the market is wrong. Real markets have fat tails. Big surprises happen more often than a clean bell curve says they should. That’s why I never sell options without defined risk, and it’s why implied volatility is the other half of this conversation.
The expected move around earnings
Earnings week is where the expected move matters most. Before a report, traders bid up the front-month options, implied volatility climbs, and the expected move widens. After the report, that volatility collapses. That’s the volatility crush.
Here’s the trap: a trader buys calls before earnings, the stock moves up $5, and the calls still lose money. Why? The market was pricing an $8 move. The stock moved less than expected, and the crush ate the premium.
Check the expected move before every earnings trade. If you’re buying options, you need a move bigger than that number. If you’re selling, you want a smaller one. This is exactly the framework behind Earnings Flips, my earnings alert service.
How I use the expected move to structure trades
This is where the number turns into a trade.
1. Strike selection. When I sell premium, I look at where the edges of the expected move sit. Strikes outside the expected move have a lower probability of being tested. Strikes inside it get paid more because the risk is higher. There’s no free lunch, just a trade-off you can now see clearly.
2. Structure. If I think the market is overpricing the move, I’ll use a defined-risk structure centered inside the range, like a butterfly spread or a Christmas tree, that makes money if the stock stays calmer than expected. If I think the move is underpriced, I’d rather own options than sell them.
3. Implied versus realized. The real edge is comparing the expected move the market priced with the move that actually happened. Track it for a few weeks on the names you trade. If a stock keeps moving less than its expected move, its options are consistently overpriced, and that’s information you can trade.
4. Position sizing. I size every trade so that a move to the edge of the expected move, or past it, is a loss I’ve already accepted before I enter. Knowing the expected move is how you know your worst normal day before it happens.
Trade example: an Earnings Flips butterfly on EBAY
Here’s how this works on a real trade from my Earnings Flips service, set up ahead of eBay’s earnings.
The setup. EBAY was trading around $110 going into the report, and the options market was pricing an expected move of about ±$9 through the August 7 expiration. That put the upside edge of the expected move near $119.
The trade. An EBAY 112/117/122 call butterfly, August 7 expiration:
- Buy 1 EBAY 112 call
- Sell 2 EBAY 117 calls
- Buy 1 EBAY 122 call
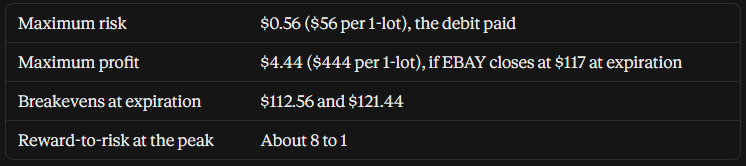
- Net debit: $0.56 per butterfly, or $56 per 1-lot
Why these strikes. I centered the butterfly at $117, inside the upside of the expected move. My view was a controlled move higher after earnings, not a blowout. The butterfly pays the most if the stock settles near the middle strike. It also benefits from the drop in implied volatility after the report, because I’m short the two middle options that were carrying most of the inflated earnings premium.
The risk and the reward at entry.
What happened. After earnings, EBAY moved toward the $117 strike, and the butterfly’s value rose to about $2.00. I closed the whole position for a 257% gain: roughly $1.44 profit per butterfly ($144 per 1-lot) on $56 of risk.
Why I didn’t hold for the maximum. The butterfly could have been worth up to $5.00 at expiration if EBAY closed exactly at $117. But holding into expiration means the stock has to stay pinned near one price, and a small move either way gives the gains back. At 257%, the trade had done its job. Taking profits locked in the gain and removed the risks of holding into expiration, including assignment.
Results from a single trade are not typical and do not guarantee future results. Options trading involves substantial risk of loss.
Expected move on SPX, XSP and 0DTE options
The same math works on index options, and it gets very practical on short time frames. On SPX and XSP, the at-the-money straddle for today’s expiration gives you the market’s expected move for today. Many traders mark those levels on their chart before the open and watch how price behaves at the edges.
XSP is one-tenth the size of SPX, which makes it a smaller way to trade the same expected move. Learn more in our guides to XSP options and 0DTE options.
Common expected move mistakes
- Treating it as a price target. The edge of the expected move is a probability boundary, not a place the stock is going.
- Mixing methods. Straddle one day, IV formula the next, and your comparisons fall apart.
- Using the wrong expiration. The expected move through Friday and through next month are different numbers. Match the expiration to your trade.
- Ignoring earnings dates. An expiration that includes earnings will have a much wider expected move than one that doesn’t.
- Selling without defined risk. The expected move is right most of the time. The times it’s wrong are the ones that end accounts.
Expected move FAQ
How accurate is the expected move?
In theory, a stock finishes within the one-standard-deviation expected move about 68% of the time. In practice it varies by stock and market conditions, which is why comparing implied and realized moves is so valuable.
Is the expected move the same as implied volatility?
No, but they’re directly linked. Implied volatility is an annualized percentage. The expected move converts it into dollars for a specific period of time.
What’s the fastest way to find the expected move?
Add the at-the-money call and put for your expiration. Many platforms, including thinkorswim, also display it directly on the option chain.
Does the expected move predict direction?
No. It’s symmetrical. It tells you how far the market is pricing a move, not which way.
Start using the expected move today
Pull up the next stock you’re thinking about trading and find the expected move before you do anything else. It will change how you pick strikes, how you size, and how you read every move the market makes.
I break down expected moves on real trades every trading day in Don’s Trading Desk. It’s free. And if you want trades built on this framework delivered to you, see my services.
Trading options involves substantial risk of loss and is not suitable for all investors. This article is for education only and is not investment advice.