Hey trader
March CPI came in at 3.3%. That sounds manageable after years of post-pandemic price chaos…but it’s not.
Dig a little deeper and we find what we all expected: Gasoline surged 21.2% in a single month. Fuel oil jumped 30.7%.
The official methodology strips energy out of its “core” reading because it is considered too volatile.
That works fine when oil spikes for a week and fades.
March CPI at a Glance
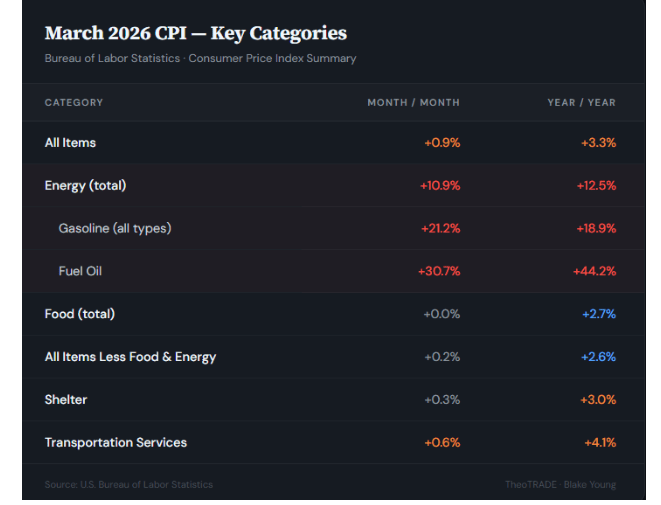
Look at the gap between “all items” and “all items less food and energy.” The headline says 3.3%. Core says 2.6%.
That 0.7% difference is doing a lot of heavy lifting.
Almost the entire monthly increase was driven by energy. Strip it out and you get a number that looks almost normal.
Leave it in and you get something much closer to what your wallet already knows.
The Problem With “Core” Inflation
Every month, the Federal Reserve and most economists focus on core CPI. That is the all-items index minus food and energy.
The logic is straightforward. Food and energy are volatile, so removing them gives a cleaner signal of underlying price pressure.
That logic breaks down when energy is not just volatile but structurally elevated.
A 21% spike in gasoline does not stay at the pump. It hits the farmer running diesel equipment to plant and harvest crops.
It hits the trucking company delivering produce to grocery stores. It hits the airline calculating ticket prices.
It hits the delivery driver dropping off your Amazon package. It hits every manufacturer whose logistics chain runs on fuel.
None of that shows up neatly in a line item called “gasoline.” It seeps into everything with a lag, and the official methodology largely lets it pass without comment.
Here is where those indirect costs actually land:
- Agricultural production (diesel equipment, fertilizer) gets embedded in food prices over a 60-to-90-day lag
- Long-haul trucking and freight gets embedded in the cost of all physical goods as contracts reprice quarterly
- Air transport (jet fuel) shows up in transportation services, already running +4.1% year over year
- Last-mile delivery gets embedded in retail and e-commerce pricing as margins compress
- Petrochemical inputs (plastics, packaging) spread across commodities broadly over time
Every one of those categories feeds back into the “core” number eventually. The lag just makes it invisible in the month it actually happens.
What 17% Really Means
The CPI officially assigns energy a weight of roughly 7% in the consumer basket. That covers the direct cost of gasoline, electricity, and heating fuel.
When researchers account for oil’s indirect role as an input cost across virtually every sector, the real energy footprint climbs to an estimated 17%. That is more than double the official weight.
Run that math against March’s data and it gets uncomfortable fast.
If oil-related costs represent closer to 17% of the basket, and those costs surged 21% at the pump with fuel oil up 31%, the energy contribution to overall inflation is being significantly understated.
The BLS framing that the 0.9% monthly increase was almost all energy is technically accurate. It is also economically incomplete.
The 8% Number Is Not Fringe Anymore
Shadowstats, which adjusts CPI using pre-1990s methodology, currently estimates inflation running near 8%.
That sounds extreme until you look at what oil is actually doing.
Before the BLS made significant changes to how it calculates CPI, the index measured something closer to the actual cost of maintaining a fixed standard of living.
The modern CPI measures the cost of a basket that consumers are assumed to adjust as prices rise. Less steak, more chicken. Less brand-name, more generic.
Those methodological choices systematically produce lower measured inflation.
If Shadowstats shows 8% and oil prices have spiked 21% at the pump while fuel oil is up 44% year over year, those two data points are not in conflict. They corroborate each other.
A true cost-of-living index that captures oil’s full economic weight would plausibly land in that range right now.
What to Watch Next
The lag is the critical variable going forward. Energy cost spikes do not fully transmit through the supply chain in a single month.
Trucking contracts reprice quarterly. Agricultural input costs hit food prices with a 60-to-90-day delay.
Plastics and packaging costs take time to work through manufacturer margins.
If oil prices hold anywhere near current levels through spring and summer, the indirect pressures now building in the system will start showing up in the core numbers the Fed watches most closely. By then, the Fed will already be behind the curve.
What This Means for Your Portfolio
The official March CPI number is not wrong. It is telling you a partial story.
When energy costs are rising 10% to 21% in a single month and oil touches every corner of modern economic life, a 3.3% headline should be understood as the floor. Not the ceiling.
There is also a broader question worth sitting with.
Last quarter’s final GDP print came in at 0.5%, well below 3% annually. If inflation is running closer to 8% while growth is stalling, that is the textbook definition of stagflation.
That combination punishes consumer-facing sectors, pressures the Fed into impossible tradeoffs, and rewards traders who are positioned ahead of the data rather than reacting to it.
Keep that in mind heading into the new week.
Blake Young
Senior Market Strategist, TheoTRADE