
Hey trader,
Block Hunter does two jobs. Most traders only use one of them.
The institutional prints pull the attention because the dollar numbers are big.
But it’s the map sitting underneath them that actually tells you where any stock or ETF will hesitate, accelerate, and reverse during the session.
That map is built from gamma exposure, and it is in the data the night before the open.
And once you learn how to read and interpret it, you’ll have a complete roadmap to the market.
For example, today’s SPY map carried three stacked levels.
- 728 was a floor.
- 730 was a magnet.
- 735 was a wall.
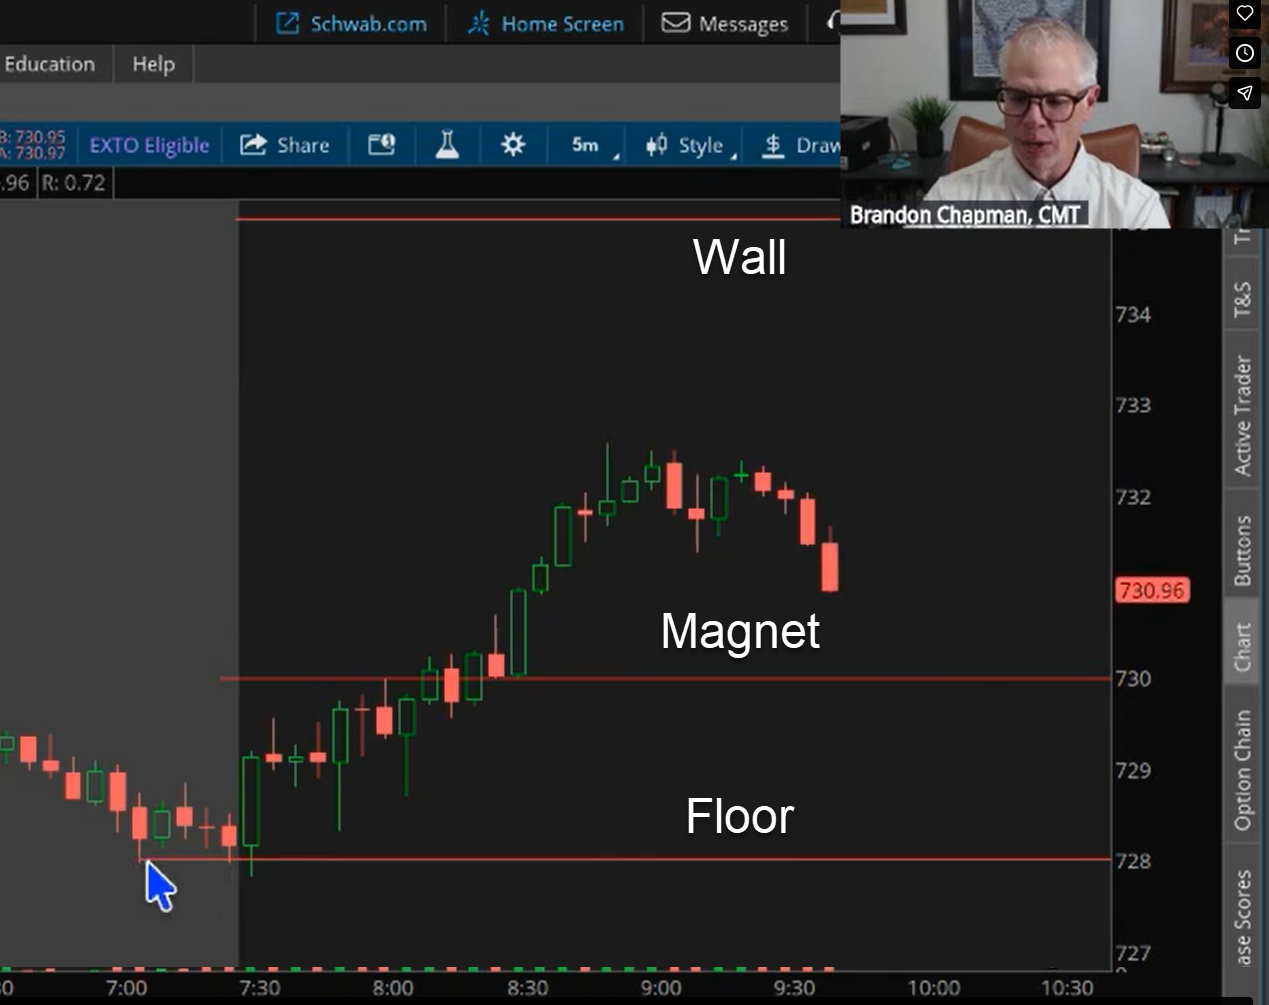
All three got respected on the tape.
They were visible before the bell rang because the math that creates them runs on yesterday’s open interest, not today’s price action.
You see, dealer positioning is fixed once the prior session closes.
Where SPY pins, breaks, and runs is already written into the options chain by the time you sit down for the open.
Now, let me show you how to find these levels.
What Gamma Exposure Is
Every option trade has two sides. A customer buys a call, and the dealer on the other side ends up short that call.
Short calls leave the dealer with negative delta. The dealer has to buy stock as price rises just to stay neutral, and sell stock as price falls.
Add that single-trade math across every open contract in the chain, and the totals at each strike show where the heaviest hedging pressure sits. That is gamma exposure.
The CMT curriculum added GEX as a topic recently, which is a sign that it has moved from hedge fund desk tool to standard reading on how price actually moves through the day.
Positive Gamma Stabilizes, Negative Gamma Accelerates
A strike with more call open interest than put interest puts the dealer in a positive gamma posture. The dealer sells rallies and buys dips at that level to stay delta-flat.
Price gets pinned inside the level rather than running through it.
A strike with more puts than calls flips the math. Dealers carry negative gamma there, so they buy into strength and sell into weakness. Moves accelerate in both directions instead of getting absorbed.
Reading the call-versus-put balance at each strike is the first half of the map. The second half is how those strikes stack against the current price.
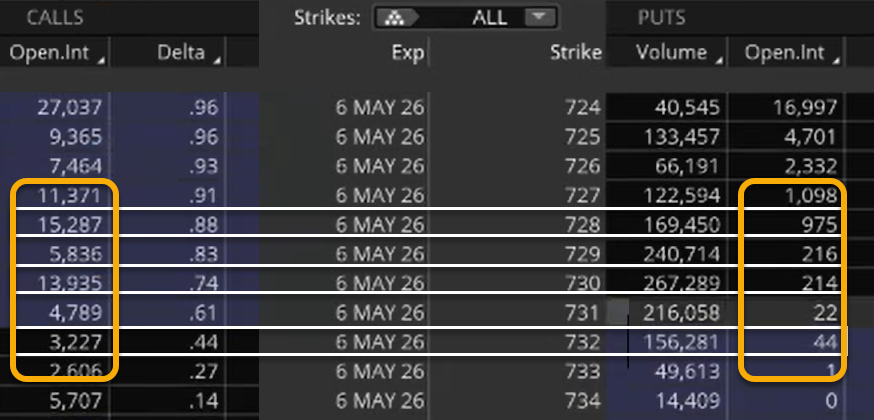
Today’s SPY Map In Practice
SPY opened above 728. That strike carried heavy call open interest carried over from yesterday and almost no put interest below it. The math made 728 a positive gamma floor for the day, and dealers were biased to buy any dip back to that level.
The next stacked strike was 730. Call open interest there outweighed puts by a wide margin, which created a magnet effect. Once price clears a floor, gamma pulls it toward the next high-OI strike.
Above 730 the chain went mostly empty until 735. That stretch is called an air gap. No stacked strikes means no hedging pressure to slow price down, and moves through air gaps tend to travel fast.
735 carried the next major call wall. Above 735 the open interest dropped off again. That level is where dealers run out of stabilizing inventory and where the next short setup lives.
How The Levels Played Out
Price opened above 728 and ran toward 730 inside the first hour. 730 held briefly, then broke once buyers pushed through.
The air gap opened up the path to 735. Pullbacks toward 730 from above ran into intensified dealer dip-buying, which is what positive gamma at a stacked level produces.
The map called the floor at 728, the magnet at 730, and the resistance at 735. The tape respected all three through the session.
Why This Works For Day And Swing Trading
There is an axiom in technical analysis that volume precedes price. Price is the most obvious thing on a chart, and it is also the least significant of the inputs that drive the next move.
Gamma exposure is the structured form of the flow that comes before the price reaction. It is the dealer’s hand on the wheel, and it is visible the night before the open through the options chain.
Day traders use the levels to set entries against floors, exits at magnets, and shorts at walls. Swing traders read the longer-dated open interest at weekly and monthly expirations, where the same math identifies multi-day inflection points instead of intraday ones.
The Console puts the prints and the map on the same screen, which is what makes the second job possible alongside the first.
See exactly how Block Hunter builds the daily gamma map.
Brandon Chapman, CMT
Creator of Ghost Prints