
Hey trader,
Yesterday I drew the line at 780 and showed you a market boxed in under a call wall at 775…
…Price has gone almost nowhere since.
A quiet range like this may look harmless. Yet, it is the most expensive place on the board to guess.
You see, you only understand half the story.
A call wall is just that. A wall.
Naturally, you’d think shorting the wall would be a great trade…
…but you’d be wrong.
Today, I want to take you a step further and explain what happens if we break the call wall.
Because if and when it does happen, the move could be violent.
Take a short at the wrong time and you could get wiped out.
But…learn to identify the turn and understand what comes next…that is what it means to trade like a pro.
Here’s how it works.
Why the Break Turns Violent
Gamma is the second derivative of the profit and loss graph.
In plain terms, it is the speed at which a dealer’s hedge has to change as price moves.
Convexity is the next step out. It measures how fast that gamma changes from one strike to the next.
At 775 the positive gamma is enormous.
Dealers sell heavily into that strike just to stay flat. That forced selling is what makes a wall a wall.
Move a few strikes higher, and the requirement collapses. The gamma does not taper off gently. It falls off a cliff.
Now the dealers who were selling have nothing left to sell.
Call buying lands on top of that vacuum.
We watched the exact sequence last week. Heavy gamma sat at 760, price cleared it, and everything broke loose from there.
The Ladder Sitting Above the Wall
Friday’s expiration shows where the rungs are.
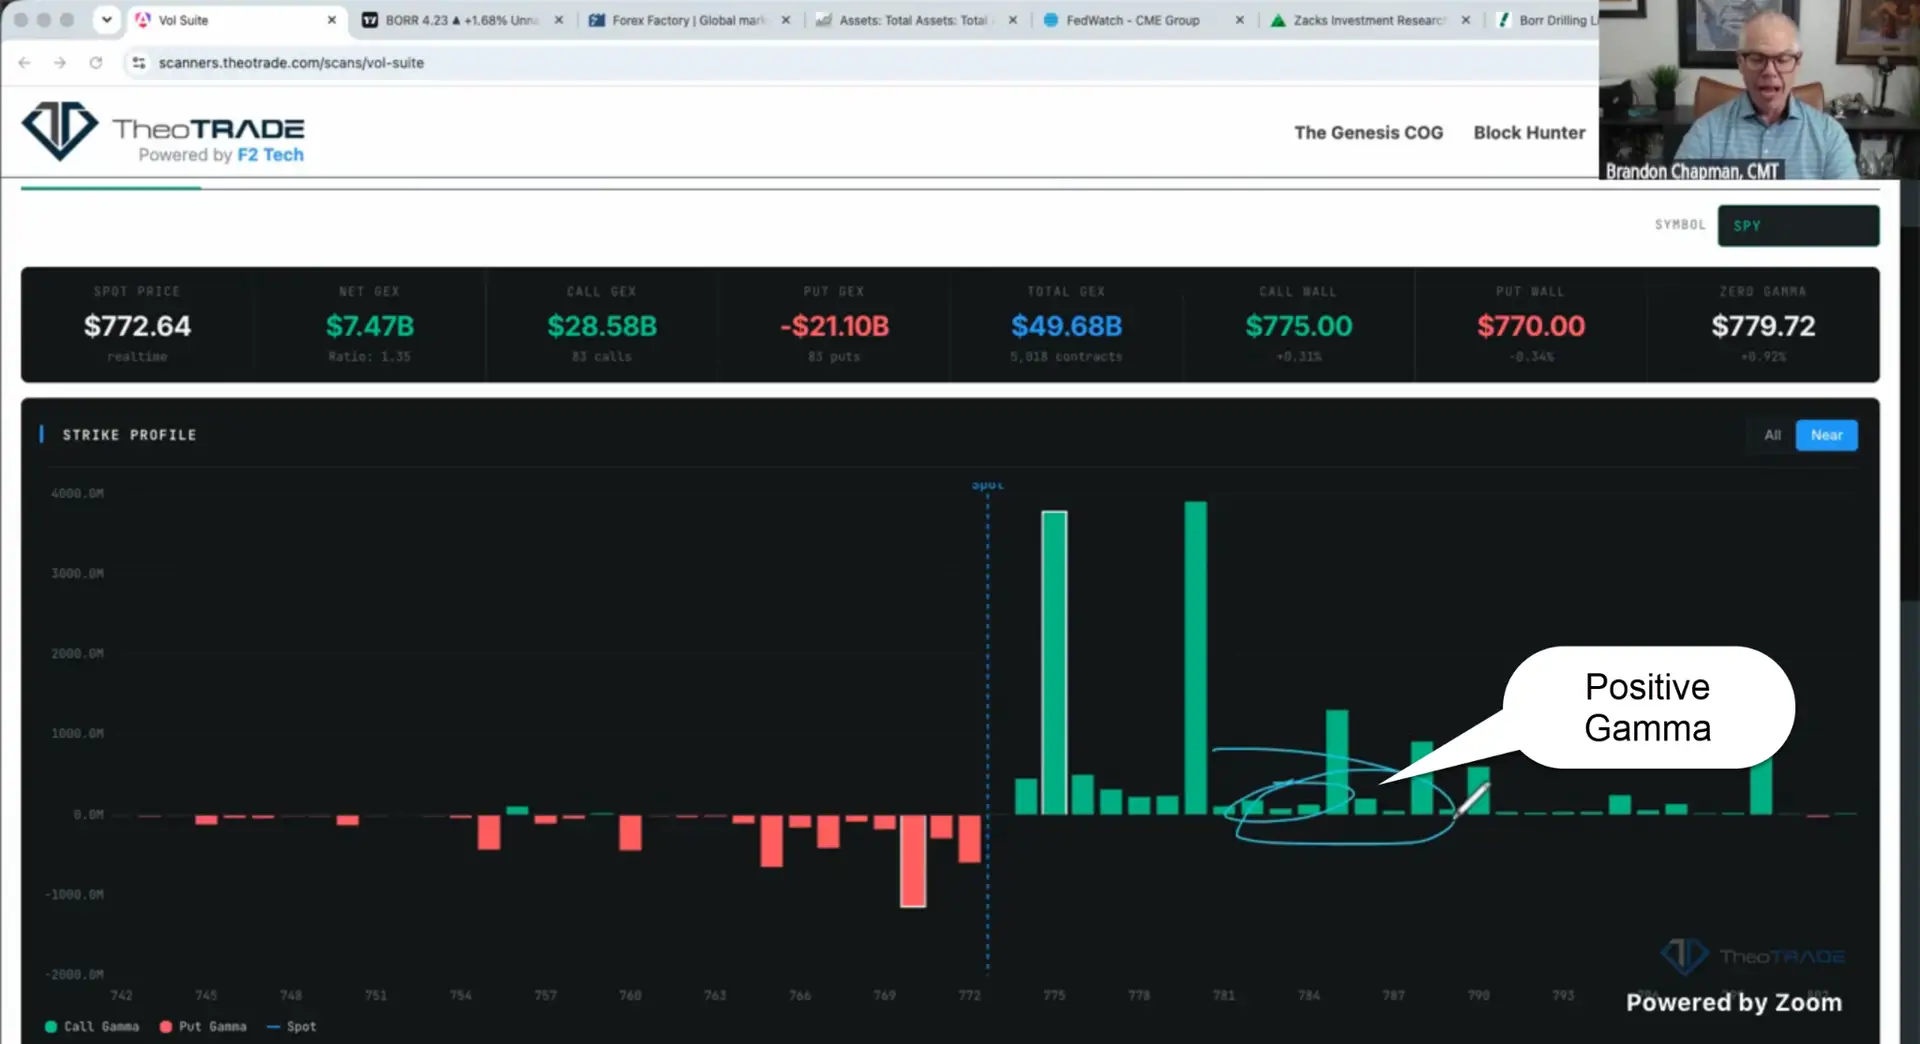
At 775, I count 82,000 contracts on one side and 147,000 on the other.
That is a massive imbalance at a single strike. Above it, the open interest drops off to virtually nothing.
Then it jumps hard. 780 carries 147,000 contracts. 788 carries 140,000.
The empty space between 780 and 788 is what ruins a short. Nothing meaningful sits in there to slow price down.
The upper expected move offers no protection either. Expected move reflects institutional expectations, and a convexity break runs straight through it.
Three Ways This Resolves
Everything hinges on where we open. That single reading tells you which regime you are trading in before the first candle prints.
Scenario one. We open above 775. That puts us in a comfortable positive gamma state with a real shot at pushing 780.
- What you want: treat 780 as the decision point, because a break there is where vol up and spot up take over and 788 comes into play
- What you do not want: fade the upper expected move on the way up, since a convexity break blows right through it
Scenario two. We open at or near 775 and the wall holds. The heavy positive gamma is still stacked at that strike, and dealers still have to sell into it.
- What you want: take the swing early that 775 holds and price pulls back toward 773, where gamma goes to zero. A 774/772 long put vertical for under 50 cents is the ideal fill, and under 60 cents still works
- What you do not want: sell verticals into this skew. Put volatility is running about 3% higher than the strike below it, which cripples the pricing on a short put spread
- What you also do not want: reach for a butterfly at 773 today. Volatility is low enough that the price is expensive relative to what you are being paid
Scenario three. We open below 770. The put wall breaks and the cushion disappears.
- What you want: watch the Console for puts getting filled at the ask into that weakness, because that is the intraday flow that drives a downside vol expansion into the end of the week
- What you do not want: sell a naked put at 770 to collect the premium. Selling a naked option into expiration is a really hard thing to do, and you are assuming all the risk at exactly the wrong level
There is a fourth outcome worth naming. We grind between 773 and 770 and pin for the rest of the session.
In that case the honest answer is that there may not be a good setup. I use 2:00 PM Eastern as my cutoff, because pinning takes over from there and the gamma sets in for the day’s expiration.
What I Am Watching Into the Data
The downside story is building slowly. Put gamma sits around $1 billion right now, up from below $500 million yesterday.
The call side still carries roughly $4 billion in net positive gamma. That structure is not bearish yet.
Positioning has shifted, though. The put to call ratio is 1.15 today. A week ago Tuesday it was 0.3.
My lean is that the wall holds. I do not think we get north of 775 this week, and I am not sure the inflation data supports it.
The bull case needs a soft print, the way the jobs number came in last Friday. That eases the worry about a rate increase at the next meeting and gives you vol up and spot up together.
Either way, the map is the same. The wall tells you where to fade. The cliff above it tells you when to stop fading and get out of the way.
Both halves of that map came off the same screen. The Console shows me the wall, the cliff above it, and the blocks that print before any of it becomes obvious on a chart.
That is the skill I spend 90 days building with traders inside the Block Hunter Challenge. You get the Console, 2 to 3 alerts a week, the weekly lotto trade, and me in the mastermind reviewing live setups with you.
Stop waiting for the chart to confirm what the flow already told you.
Start the 90-Day Block Hunter Challenge here.
Brandon Chapman, CMT
Creator of Ghost Prints