
Hey trader,
Forget semiconductors. Banks have been ripping higher for weeks.
The easy move is to trust the run. One print this morning did not fit that calm.
A single institution bought 12,000 put options on XLF, the large financial-sector ETF, in one shot.
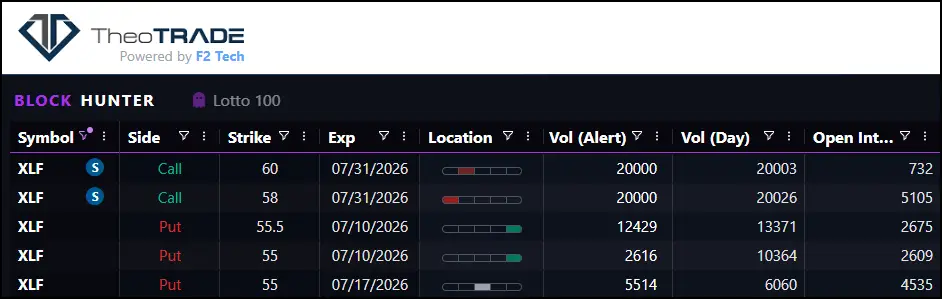
That block hands me something the chart cannot – a level a big player is bracing for, close enough to bite.
Everything turns on one line.
Hold above it and this stays a healthy climb.
Break below it and the selling can start to feed on itself.
That line is where I begin, and it points to a cheap, defined-risk trade.
The Print That Broke The Calm
My Console flags large option trades as they cross the tape. It shows the size and which side each print hit.
One XLF trade stood out from everything else this morning. A single institution bought 12,000 put options at the 55.50 strike, out to this week’s expiration.
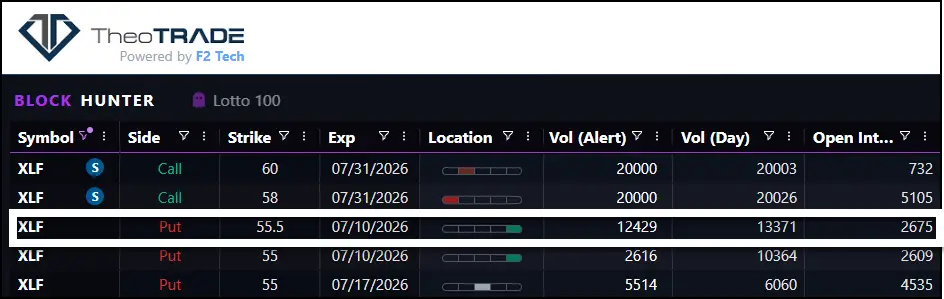
It printed as a buyer. Buying 12,000 in a single shot is a deliberate bet.
A put pays off when price falls below its strike. This one is a wager that XLF heads toward 55.50.
That 12 delta is the tell. The option barely moves with the ETF today, so it behaves like a cheap long shot parked just under the market.
The strike is not far off. XLF has been pressing the 56 level, and 55.50 sits right beneath it.
Financials have earned the climb. Call buyers leaned on XLF for the upside two weeks running.
The ETF has now brushed the top of its expected weekly range two weeks in a row. That upper band is the ceiling options traders priced in for the week.
Touching it twice tells me the run is stretched.
Why 56 Is The Line That Counts
Above the market sits a wall of calls. Roughly 50,000 contracts are stacked at the 56 strike, much of it sold in one block on July 1.
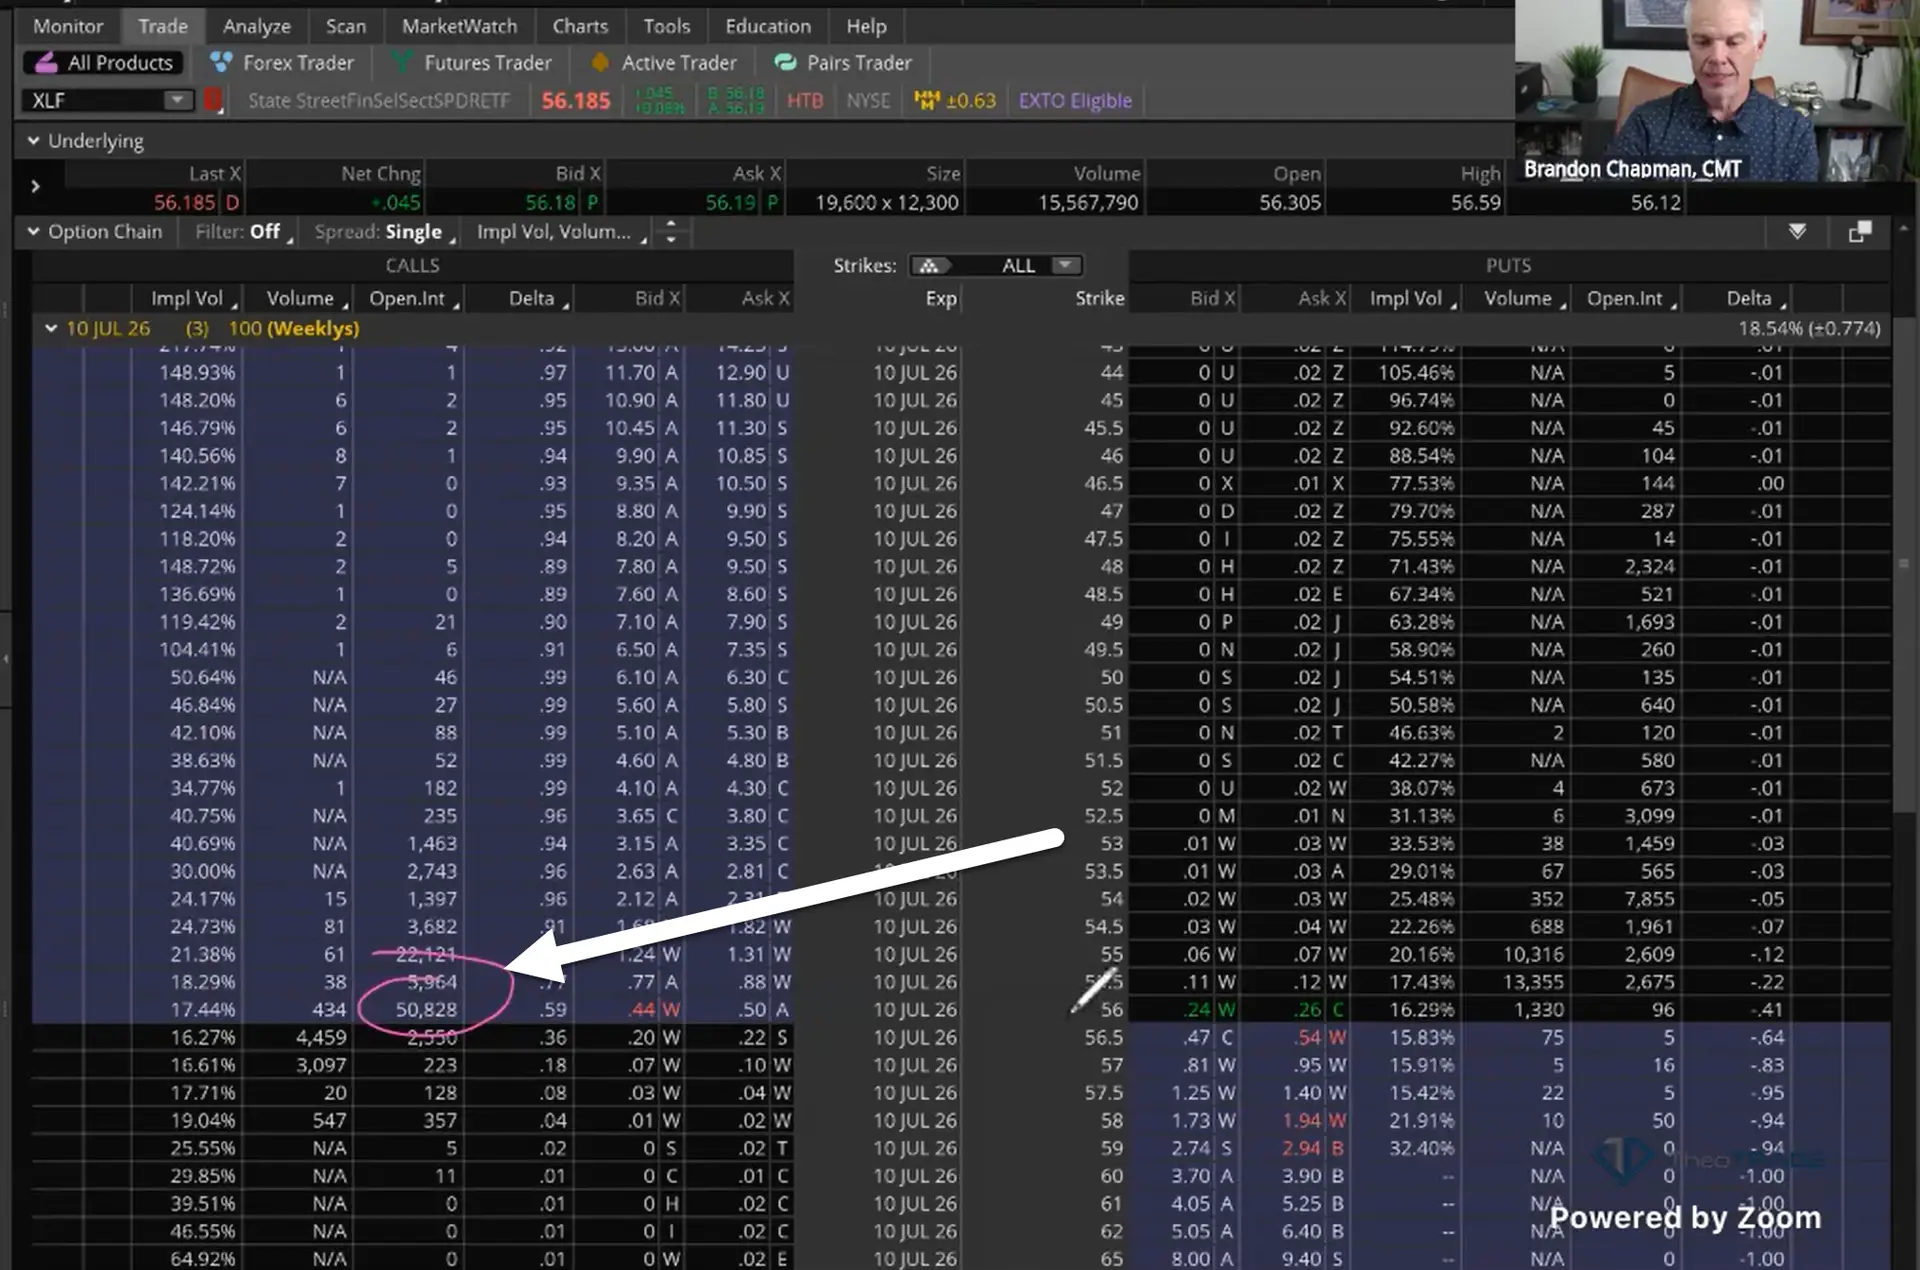
Those calls act like brakes. The firms on the other side hedge to stay balanced, so they sell into strength and buy dips near 56.
That two-way hedging pins price to the wall. While XLF holds above 56, the ETF stays calm.
The whale’s puts sit quiet below, pulling only lightly. The story changes under 56.
Below the wall, the 55.50 and 55 strikes turn into accelerators. Here is the mechanic behind that word.
The firms that sold those puts must short XLF as it falls, just to stay balanced. Their selling feeds the decline instead of cushioning it.
Traders call that negative gamma, where hedging speeds a move along rather than calming it. The tape already leans that way.
Sellers are hitting the calls while buyers load the puts. That is the exact flow that stacks the downside fuel underneath.
How I’d Frame The Trade
Let me assume I take this trade today. I would keep it simple and defined.
I would buy the 56 put and sell the 54 put, a one-month spread that runs about 58 cents. That 58 cents is the most I can lose, fixed the moment I enter.
I do not need a collapse for this to pay. XLF only has to slip to 55, the lower end of this week’s expected range.
At that point the spread is worth close to a dollar. That is roughly a 70% gain, and I am out.
The trade does not require a bearish call on the whole market. Even with banks running strong, a defined-risk lean like this still makes sense.
Here is the structure in plain terms.
- Setup: a single institution bought 12,000 XLF puts at the 55.50 strike into this week, filled as a buyer, with roughly 50,000 calls walled at 56
- Structure: a one-month XLF put spread, buying the 56 and selling the 54, near 58 cents
- Trigger: XLF losing 56, where the call wall gives way and the negative gamma below takes over
- Target: 55, with 55.50 the strike the institution built around
- Invalidation: XLF holding above 56, where the call wall pins price and drains the move
- Max risk: the 58-cent debit, known going in
- Edge: the negative skew prices this spread in my favor, and the quiet puts below speed the move up as price falls toward them
What I’m Watching Now
None of this fires on its own. XLF has to lose 56 before the structure underneath means much.
That is the number that counts. Hold above 56 and the wall keeps the ETF pinned.
The whale simply waits. So do I.
Lose 56 and the puts below wake up. Dealers sell into the slide, and 55 comes into reach faster than the drop that started it.
The order of events is the lesson. One print marked the level and the lean before the chart showed a thing.
The selling, if it comes, arrives second.
Brandon Chapman, CMT
Creator of Ghost Prints