
Hey trader,
The S&P 500 is sitting a smidge off its highs, and nothing on the chart looks broken.
Last week I handed you 775 and 780 as the entire map. Both levels held. The plan worked.
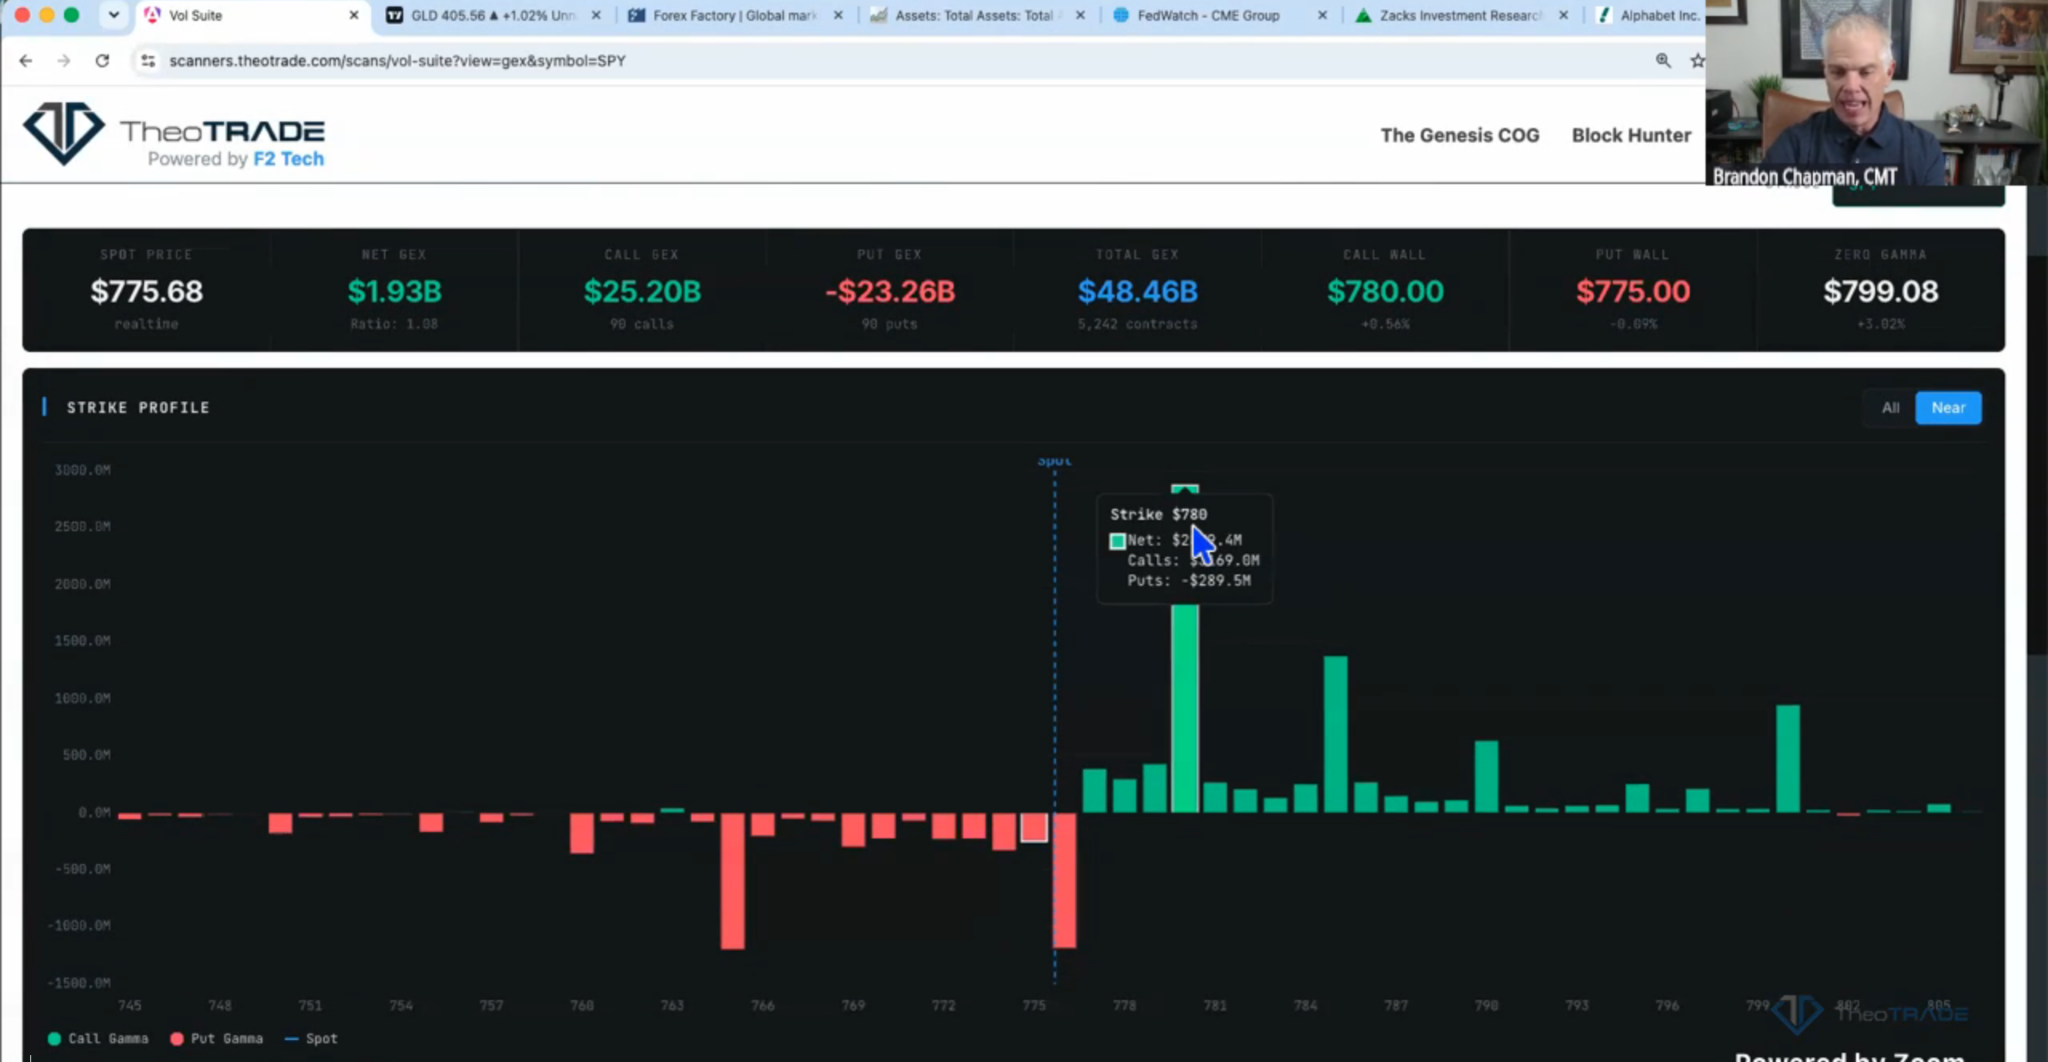
Something shifted underneath over the weekend. The 780 call wall is still standing at roughly $2.8 billion, and it swells toward $4 to $5 billion as price grinds higher.
That wall is only half of the picture now.
Down at 765, there is about $1.2 billion of negative gamma. A week ago, everything below current prices was under $500 million.
Negative gamma means dealer hedging pushes a move along instead of absorbing it.
Price is sitting in that region right now, with positive gamma directly overhead and no cushion in between.
What does a market do when there is nothing left in the middle to slow it down?
Let me show you the box.
The Cushion That Held for Two Weeks Disappeared
Look at what price had to work with the last two weeks.
Positive gamma sat above, a zero gamma pocket sat in the middle, and negative gamma sat well below.
That middle pocket did the real work. Price could wander into it without dealer hedging amplifying anything in either direction.
When we were below 775, the cushion ran all the way down to 770.
Then we broke above 775 and dismantled that strike.
The positive gamma there has been reduced, and the break opened up negative gamma underneath it.
Today there is no zero gamma pocket at all. Price tips straight into negative gamma below or positive gamma above, with the wall at 780 capping the top.
This is the first Monday in three weeks I am leaning on negative gamma instead of a big positive gamma cushion.
Two Accelerators, Fifteen Points Apart
Last week the range ran about 758 to 780. Call it $22 of room. This week is not going to be that big.
Here is the box. 780 on top, 765 on the bottom.
Both of those levels accelerate price rather than simply stopping it.
Friday’s expiration carries 70,000 contracts at 780. Just above the strike, the open interest goes to nothing.
That collapse is dealer convexity.
Essentially, the hedging requirement above the strike does not taper off gently, it vanishes at 781.
Break 780 with call buying landing on that vacuum, and dealers have to buy to support the move until 785 materializes. That is the vol up, spot up scenario.
765 runs the other way. We might get sticky there, and losing it opens up significant volatility expansion below.
The intensity builds into Friday. In negative gamma, dealers sell the dips, and that selling gets heavier as the weekly expiration approaches.
Why I Sold the 780 Wall and Not the 765 Floor
780 is not in play today.
The delta on today’s expiration is three, so the probability of expiring up there is virtually nil.
Friday is a different story. That same strike carries a 27 delta for Friday’s expiration, which puts it right in the wheelhouse.
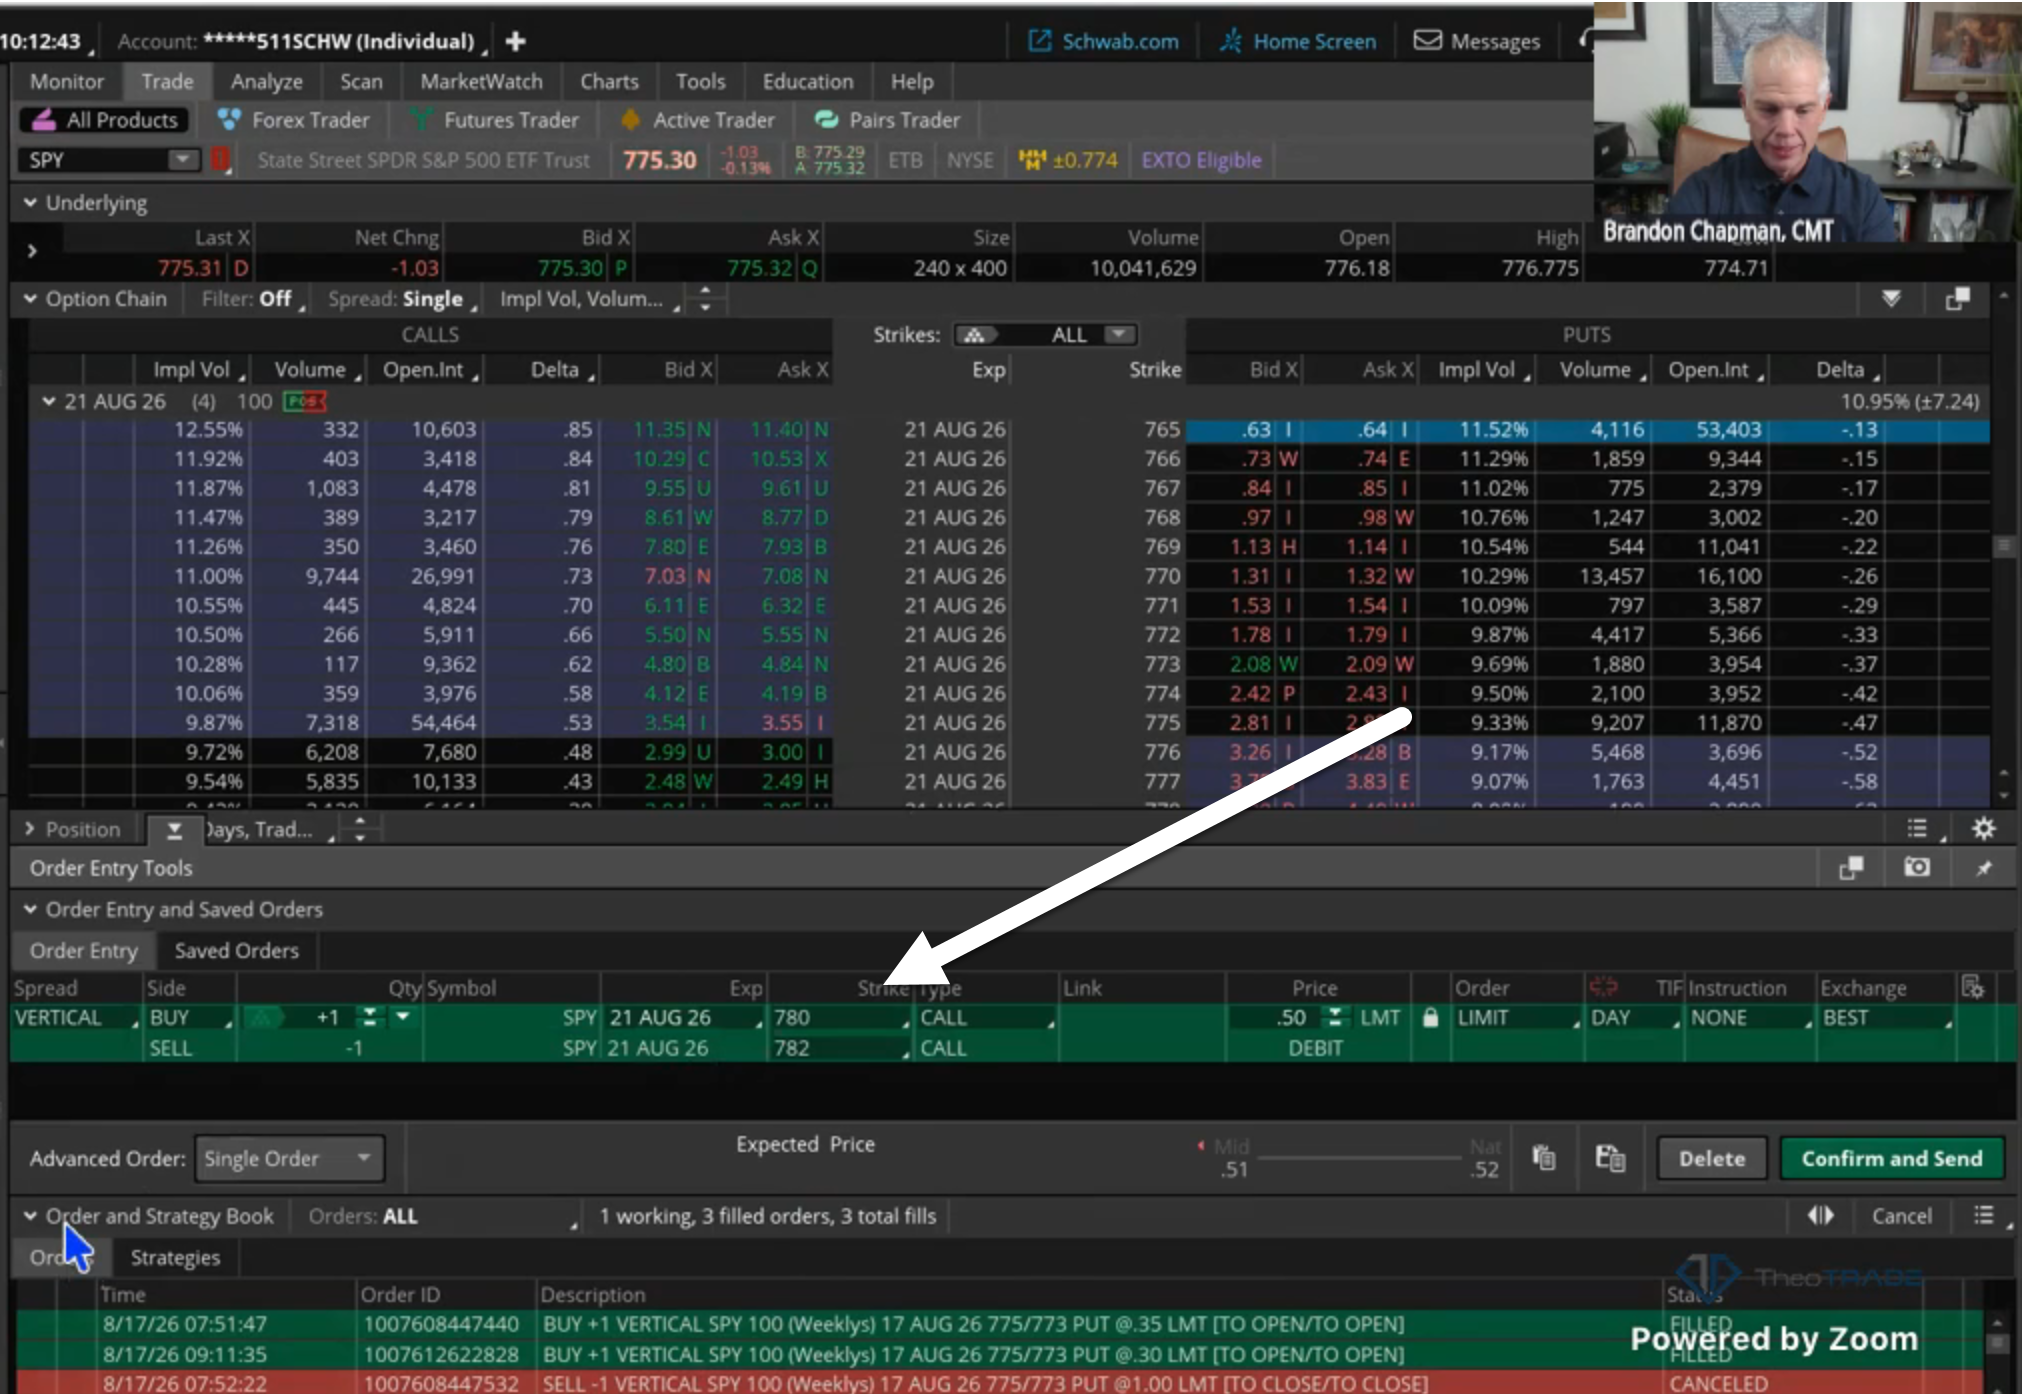
So I sold the 780/782 call vertical for Friday at $0.49. A vertical means I sold the 780 call and bought the 782 above it, which caps my loss at the $2 width.
Here is how the position is built:
- Setup: short the 780/782 call vertical, Friday expiration, filled for a $0.49 credit
- Target: buy it back for $0.10 or less, resting GTC
- Max risk: $1.50 against the $0.50 I am collecting
- Edge: 780 sits at roughly $2.5 billion right now, and it gets bigger as price moves toward the strike into expiration
- Sizing: if I normally trade two contracts, I sell two
I would struggle selling the downside here. 765 sits inside our negative gamma region, and the skew works against that side for Friday.
Selling 780 means selling the higher strike with lower volatility. Basically, the pricing incentivizes buying puts and selling calls, not the reverse.
What I Am Watching Into the Rest of the Week
My lean is the downside. The negative gamma environment intensifies as we move toward the end of the day and toward Friday, which expands the downside potential of the market.
Break 780, though, and heavy positive gamma takes over above. Vol up carries us to 785 quickly, and clearing that level is the bull case.
Right now we are boxed in. Break out in either direction and we could see a big move.
One discipline note. I do not take new positions after 2:00 PM Eastern, because pinning takes over from there. I will manage what I already have.
The map has not changed shape. The wall tells me where to sell, and the level underneath tells me where the move gets loud.
The map has not changed shape. The wall tells me where to sell, and the level underneath tells me where the move gets loud.
Both halves of that map came off one screen. The Console showed me the 780 wall growing, the 765 gamma building where there was nothing a week ago, and the cliff at 781 that turns a breakout into a chase.
That is the part I want you to be able to see on your own. Reading a level is one skill. Knowing whether the flow behind it forces dealers to buy or sell is the skill that pays.
I spend 90 days building exactly that with traders inside the Block Hunter Challenge. You get Console access, 2 to 3 alerts a week, the weekly lotto trade, and me in the mastermind reviewing live setups with you.
The next time this market slips out of its box, you can watch it happen or you can already know which side has to hedge.
Start the 90-Day Block Hunter Challenge here.
Brandon Chapman, CMT
Creator of Ghost Prints