Hey trader,
The U.S. Treasury made history yesterday.
Not liking the direction of rates, they stepped into the bond market yesterday to absorb selling.
That sent bonds soaring yesterday…but it was short-lived.
Today, the banks are bearing the fallout.
Citigroup is down 1.02%…
…Bank of America down 0.89%…
…JP Morgan down 0.89%….
Makes sense if you think about the relationship between banks and interest rates.
But I also found something interesting in the Block Hunter Console.
Almost 10% of today’s unusual prints came through financials.
That’s not normal.
One of them was 3,030 contracts bought in a single trade: September 120 puts in Citigroup.

That is a third of the entire day’s option trade in the name.
And it carries a symbol, a direction, a target, and a deadline.
Somebody is willing to pay for Citigroup at 120 by September expiration.
I want to show you why they picked that bank and what the option chain says about their odds.
Why the Big Banks Sit Closest to the Bond Market
The money center banks hold enormous amounts of Treasury paper.
When bond prices fall, the value of what they are holding falls with them.
That relationship is not theoretical.
When Silicon Valley Bank went down, Bank of America carried the second-most exposure to the Treasury market of anyone.
So when I am anticipating weakness in bonds, Bank of America is on my list. Citigroup is right there next to it.
I reset my filters in the Console and pulled up the financial sector.
67 prints came back out of 782 on the day.
That is almost 10% of everything on my screen sitting in one group.
I then typed in BAC, WFC, XLF, and KRE individually. Nothing came up in any of them.
Citigroup was the one carrying real size.
What 3,030 Contracts Actually Tell Me
The print fills in four blanks for me at once: I get the symbol, the direction, the target, and the timeframe.
The target is 120 by September expiration. That is the expectation being paid for.
Delta was about 13 when it filled, reading 14 now. Delta reflects the probability, essentially the market’s own estimate of the odds price gets there.
So this is a low-probability, high-payoff position. That does not make it noise.
3,000 contracts is a third of the option trade in Citigroup today. Total volume is running about 1.4 times the average.
They are buying puts. They are selling calls.
That combination is what builds a downside gamma regime. Put options keep getting added below the market, and that pressure compounds as price breaks lower.
The Option Chain Confirms the Print
I want a second read before I act on any block. The volatility structure gives me one.
Look at the September 18 put chain moving down the strikes. Volatility goes 27, then 28, then 29.5, then 32.
That is a parabolic move higher in vol as you go further out of the money. The call side is doing the opposite and dropping all the way until about 150.
Vol rises where the buying is. Vol falls where the selling is.
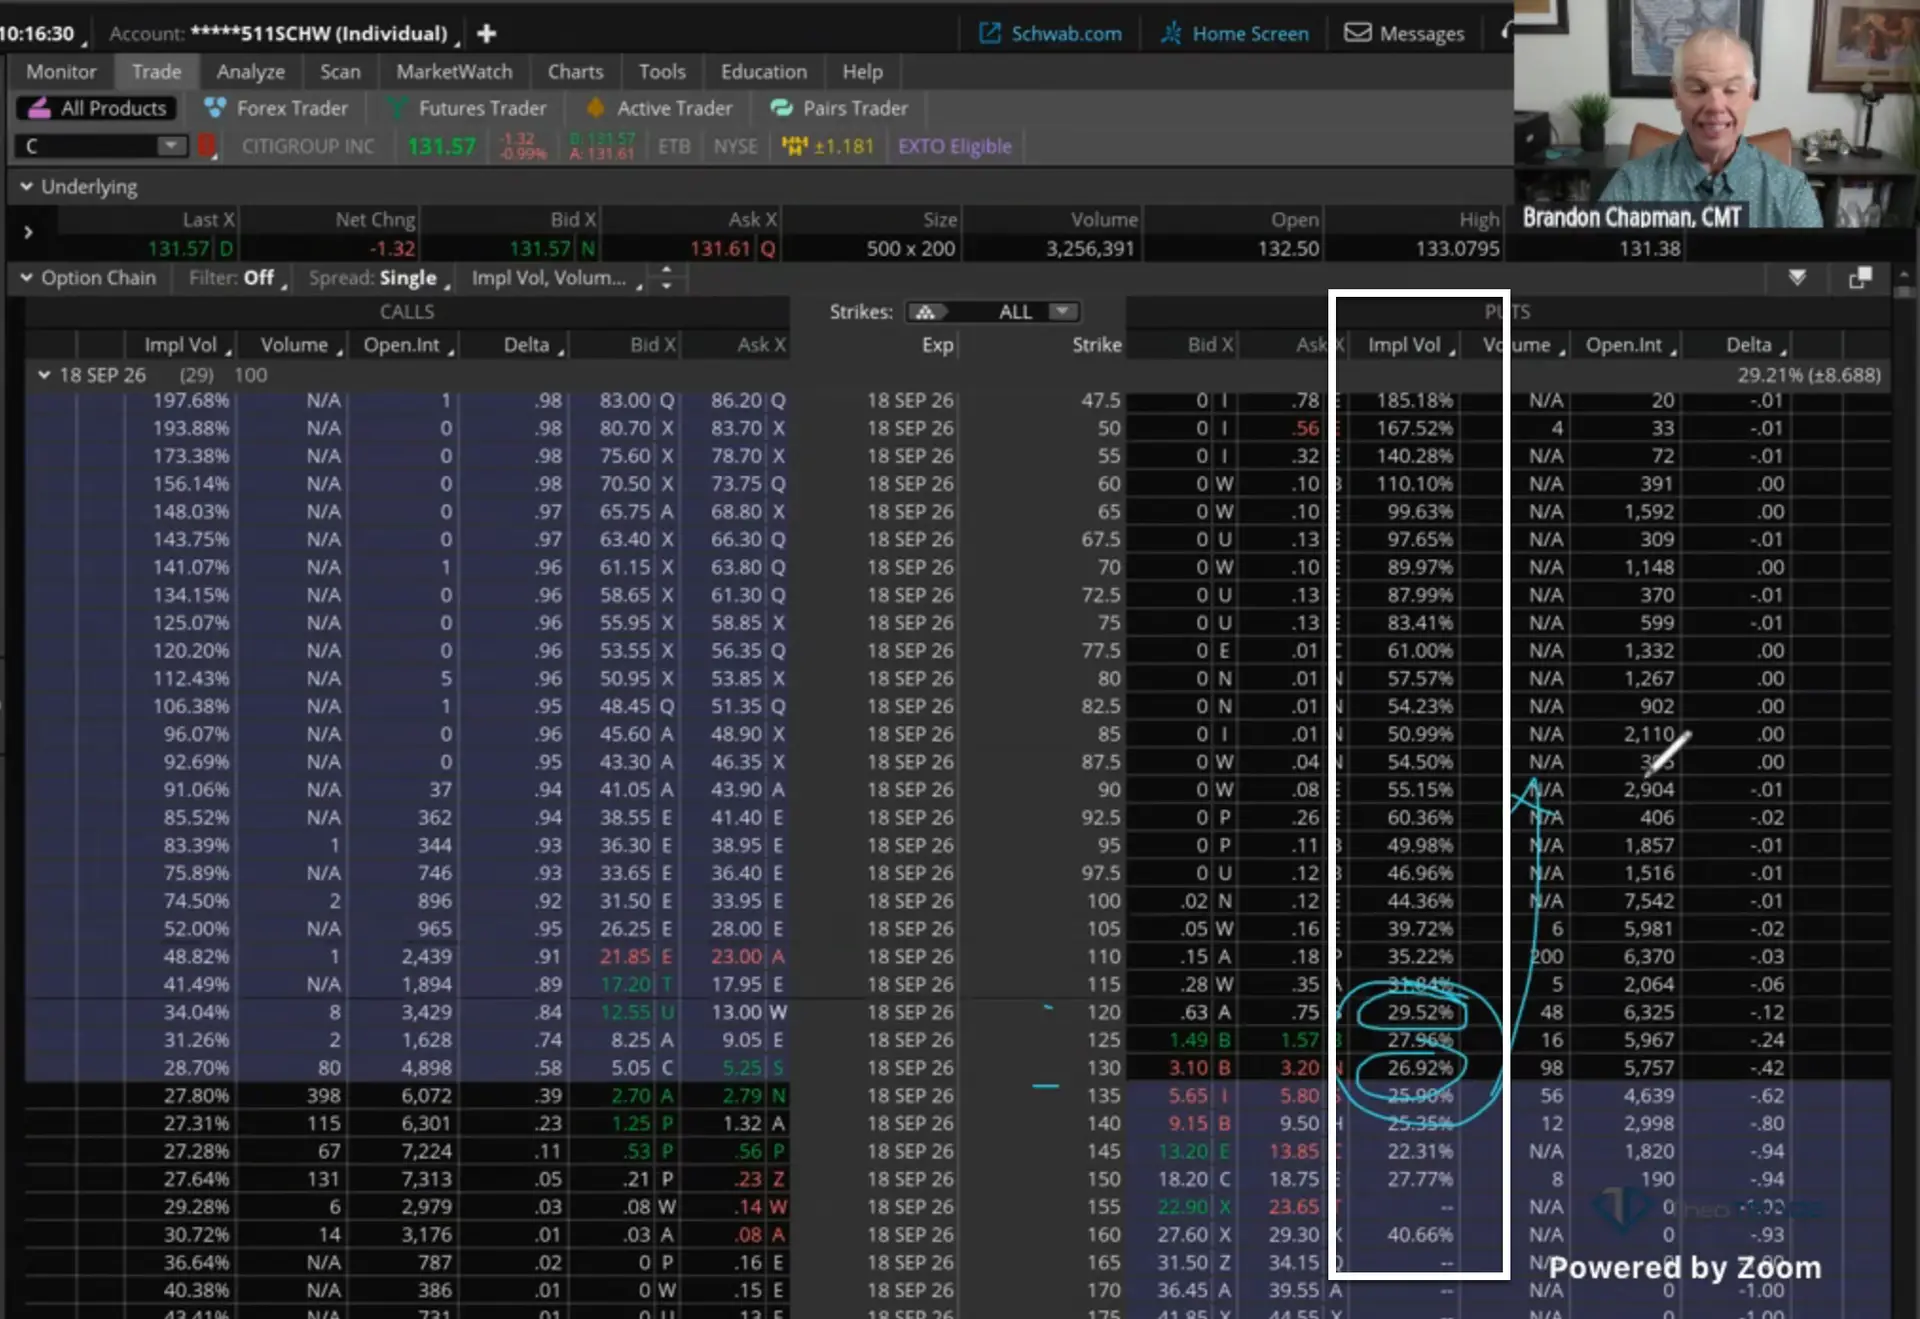
That shape tells me which structure belongs here. When vol is cheap at one strike and significantly more expensive $10 away, the natural trade is a vertical.
A vertical is two options in the same expiration. I buy one strike and sell another below it, moving vertically down the chain.
I want to buy the low volatility and sell the high volatility. That differential is the edge, and it makes the spread cheaper to own.
How I’m Structuring It in XLF
I do not have to trade Citigroup itself. 3,000 contracts is a big trade for that stock, and it is not going to be the sole thing that moves it.
XLF gives me the whole group instead. Schwab, Berkshire, BlackRock, Bank of America, Morgan Stanley, Wells Fargo, and American Express are all in there.
The skew in XLF is actually steeper than what I saw in Citigroup. I am looking at 13.5% against 16%, which is 2.5 points of volatility across a $2 move.
XLF is trading at 57.33 and sitting near the lows. The 40 delta strike is the first one out of the money, 35 cents away.
Here is the structure I like on an eight-day basis.
- Setup: buy the 57 put, sell the 55 put in XLF, eight days to expiration
- Cost: 25 cents
- Trigger: the SPY breaking 765
- Target: close around a dollar, which is roughly where the spread prices with XLF at 56
- Edge: buying 13.5% volatility and selling 16% volatility
- Max risk: the 25-cent debit
Breakeven sits at 56.75. Getting to 56 turns 25 cents into about a buck, which is a 300% gain.
The probability of touching 56 by next week runs around 28%. Touching 56.50 runs about 46%.
That is a three-to-one payoff on a roughly 30% shot. The tradeoff is that shorter time means it lands on max gain or max loss with little in between.
If you want more room, the same 57/55 spread thirty days out costs 44 cents. It gets you to about a dollar around 56 as well, with far less urgency.
What I’m Watching Next
Everything here hinges on one number. 765 on the SPY is the level for this week.
That strike is a massive put wall, with roughly 41,000 contracts of open interest into tomorrow’s expiration. Below it there is a drop-off until 761 and 760.
If we break 765, volatility can expand quickly to the downside. That is the moment these financial spreads start working.
Until then, I am letting the print do the talking.
One Print Is a Clue. Learning to Find Them Is an Edge.
Everything in this issue started with a single row on my screen. The Treasury story was public. The bank weakness was public. The 3,030-contract print was sitting there for anyone who knew where to look.
That’s the part I want to hand you.
Blocks like that show up every session, in names nobody is talking about yet. They tend to show up before the chart makes the move obvious.
Waiting for the breakout candle means waiting for the pressure to already be spent.
Inside the 90-Day Block Hunter Challenge, I’ll show you how I hunt for these in real time.
You get the Console I used today, 2 to 3 alerts a week, my weekly lotto trade, the live Masterclass, the Block Hunter Chat community, and 90 days of mastermind sessions with me.
Ninety days is enough repetition for this to stop feeling like a concept. It starts becoming how you read the tape.
If it doesn’t deliver real value for you, the 30-day money-back guarantee covers it. The risk sits with me.
Come find the next one with me.
START THE 90-DAY BLOCK HUNTER CHALLENGE FOR $995
Brandon Chapman, CMT
Creator of Ghost Prints