
Hey Trader,
The best information in trading tends to be free, boring, and sitting in plain sight.
A weekly candle has a high and a low. Those two prices are where five full sessions of voting stopped.
Every institution, every algorithm, and every retail account got a say in them.
They don’t repaint. They don’t lag.
They’re identical on my chart and yours. Big money knows exactly where they sit, so resting orders pile up around them.
Here’s the catch. Those numbers live on the weekly chart, and almost nobody trades off a weekly chart.
Last week showed what happens when you move them somewhere useful.
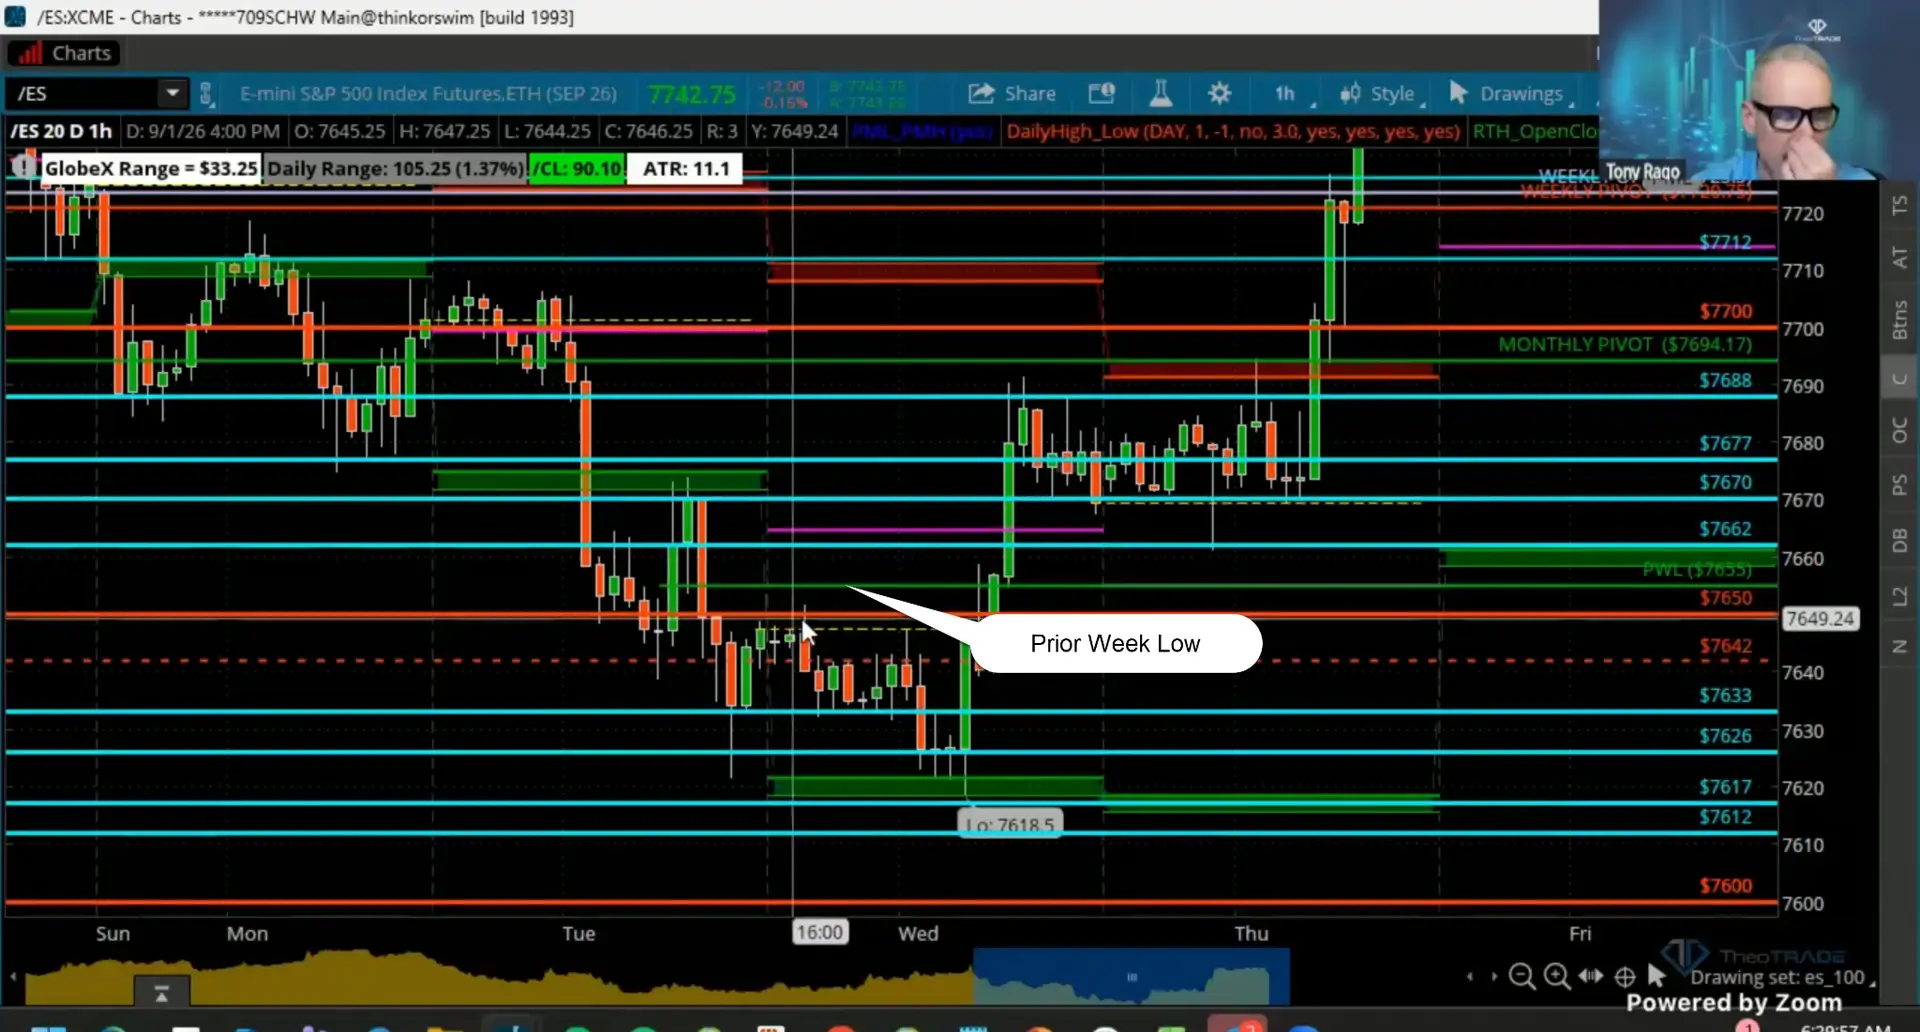
NQ swept its prior week low. ES spent an entire session plus a Globex sitting underneath its own.
The line was 7662. It went into Wednesday’s pre-market playbook before anybody clicked a button.
“Once they hop back over the 7662, that was it. That’s all they had to do was hold that. And then I think they got caught everybody leaning the wrong way in this market.”
Ten seconds of work set up the entire week.
Below I’ll cover what the line is, where it comes from, why professionals watch it, how I use it live, and last week’s example.
The Line Is Just Where Last Week Stopped
There’s no calculation here and nothing to configure.
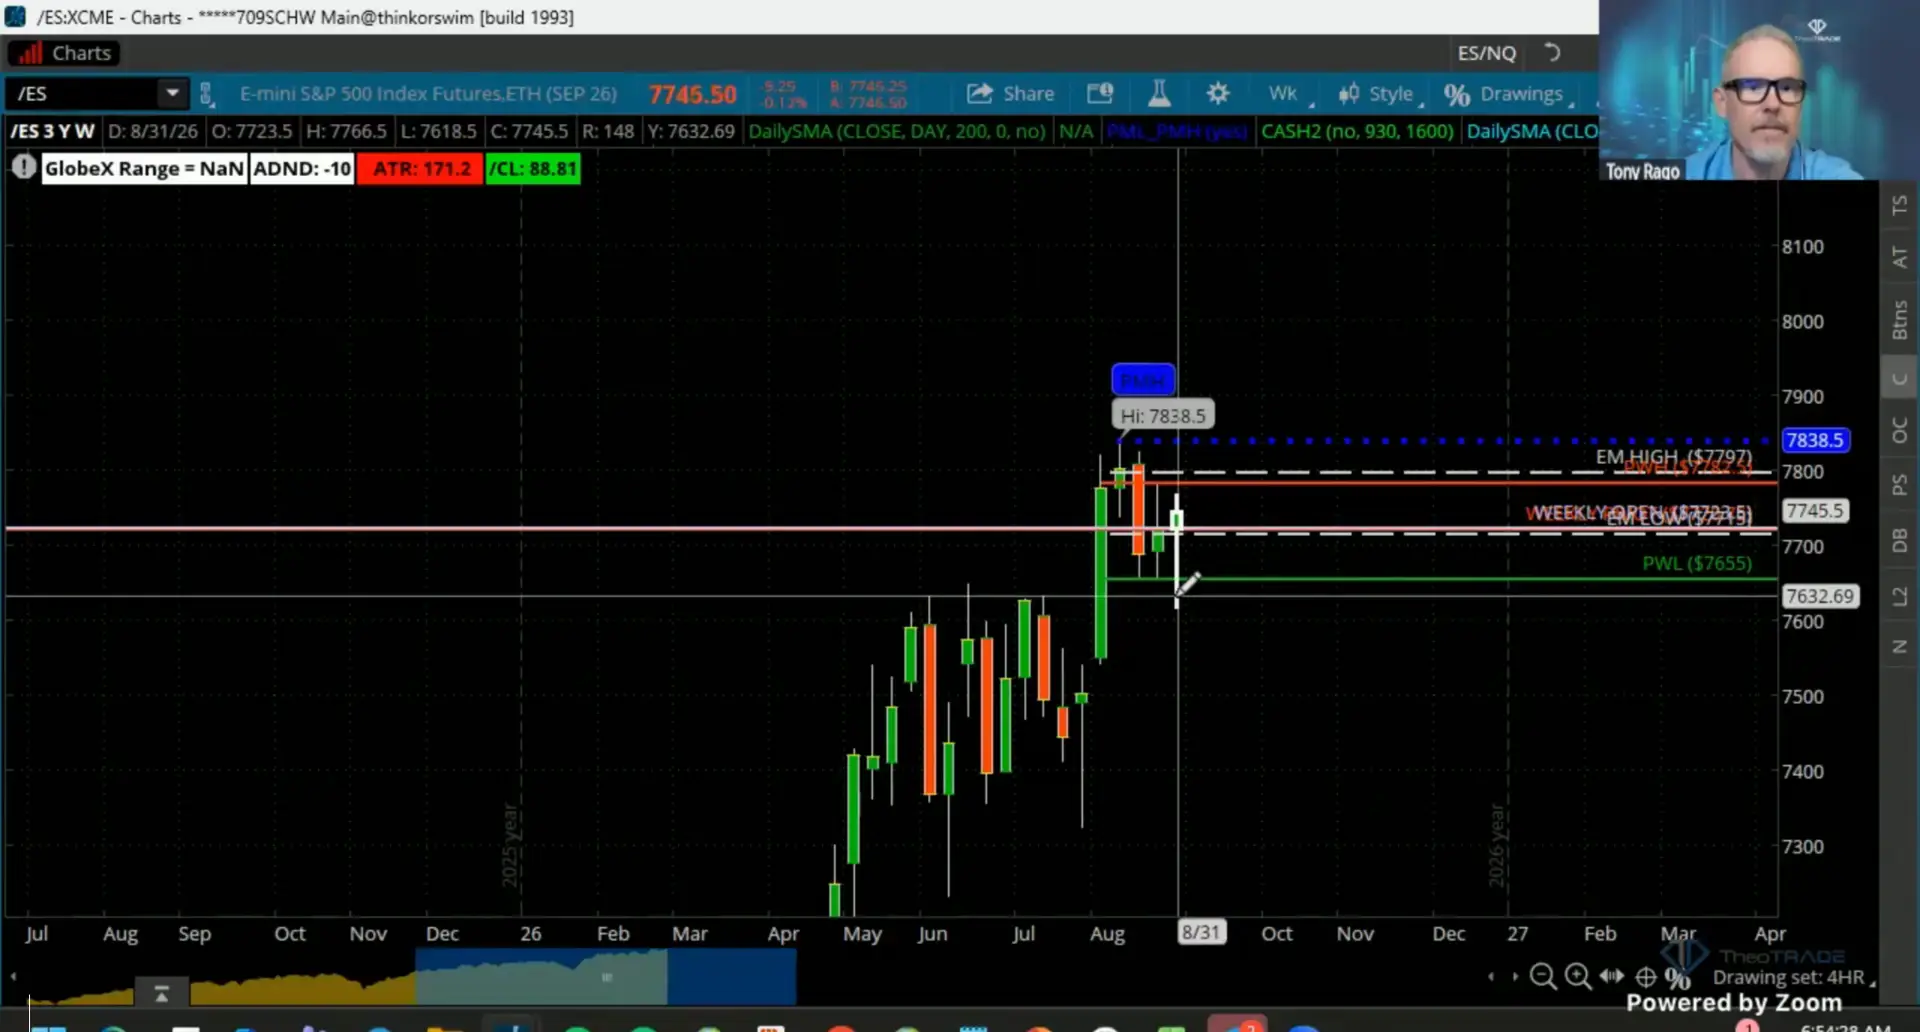
Pull up the weekly chart on whatever you trade. Find last week’s candle, then write down the high and the low.
That’s the whole process.
Go back to the timeframe you actually work on and draw both as horizontal lines. Leave them there all week.
I told the room exactly this on Friday, because the weekend is when the work is cheap:
“Take that big weekly bar and just put a high and a low on your chart that you normally trade. Keep an eye on it.”
While you’re there, mark the halfway point of the bar and the 618. On a big breakout week those two do a lot of work.
Why Anyone Cares Where Last Week Stopped
A weekly low is a reference point that thousands of accounts share.
Traders who are long defend it. Traders who are short target the stops underneath it.
Breakout traders wait for a close on the other side. All that order flow gets aimed at the same handful of ticks.
That concentration turns a boring line into a decision point.
Price rarely wanders through one of these quietly. When it does go quiet nearby, the stillness is information too.
The other reason I like them is they hold up when nothing else does.
Volatility went to sleep on us for most of August. Participation was thin and the tape spent a lot of energy fighting itself.
Through all of it, the weekly extremes kept producing reactions.
Levels that matter are usually the simple stuff. That has been true my entire career.
The Sweep and the Reclaim Do Different Jobs
Here’s where the mechanics live, and the distinction is everything.
A sweep means price trades through the level and takes the stops sitting under it. By itself, that’s just a stop run.
It tells you liquidity got collected. It doesn’t tell you what happens next.
A reclaim means price goes back over the level and holds it. That’s the signal.
Last week gave us both parts in sequence. NQ swept the prior week low first.
ES then spent an entire session plus a Globex underneath its own. That’s a long time for sellers to hold territory without doing anything with it.
Waiting through that part is the hard piece:
“That’s why it was so important to wait and see if they could reclaim that.”
Once ES came back over 7662, the trade wasn’t complicated anymore.
The bulls had one job from there, which was holding the line they had just taken back.
They held it Thursday and came out swinging on both instruments. They did it with oil bid above 92.
Plenty of traders were positioned against that move because the oil bid told them to be.
The level told a different story. The level won.
The Same Mechanic on a Smaller Timeframe
This scales down, and Friday gave me a clean version of it.
I sat through a lot of chop early. Point of control was parked at 605 to 600 on NQ with the ES equivalent down at 7690.
That is exactly why the tape was going nowhere.
Then the sellers finally wore down and I bought the 88 on the back through. I said why on air while I was doing it:
“Stick to the plan. Buy the 88. Why the 88? Because it’s cash, it’s prior day high. All the things.”
Same idea, shorter timeframe.
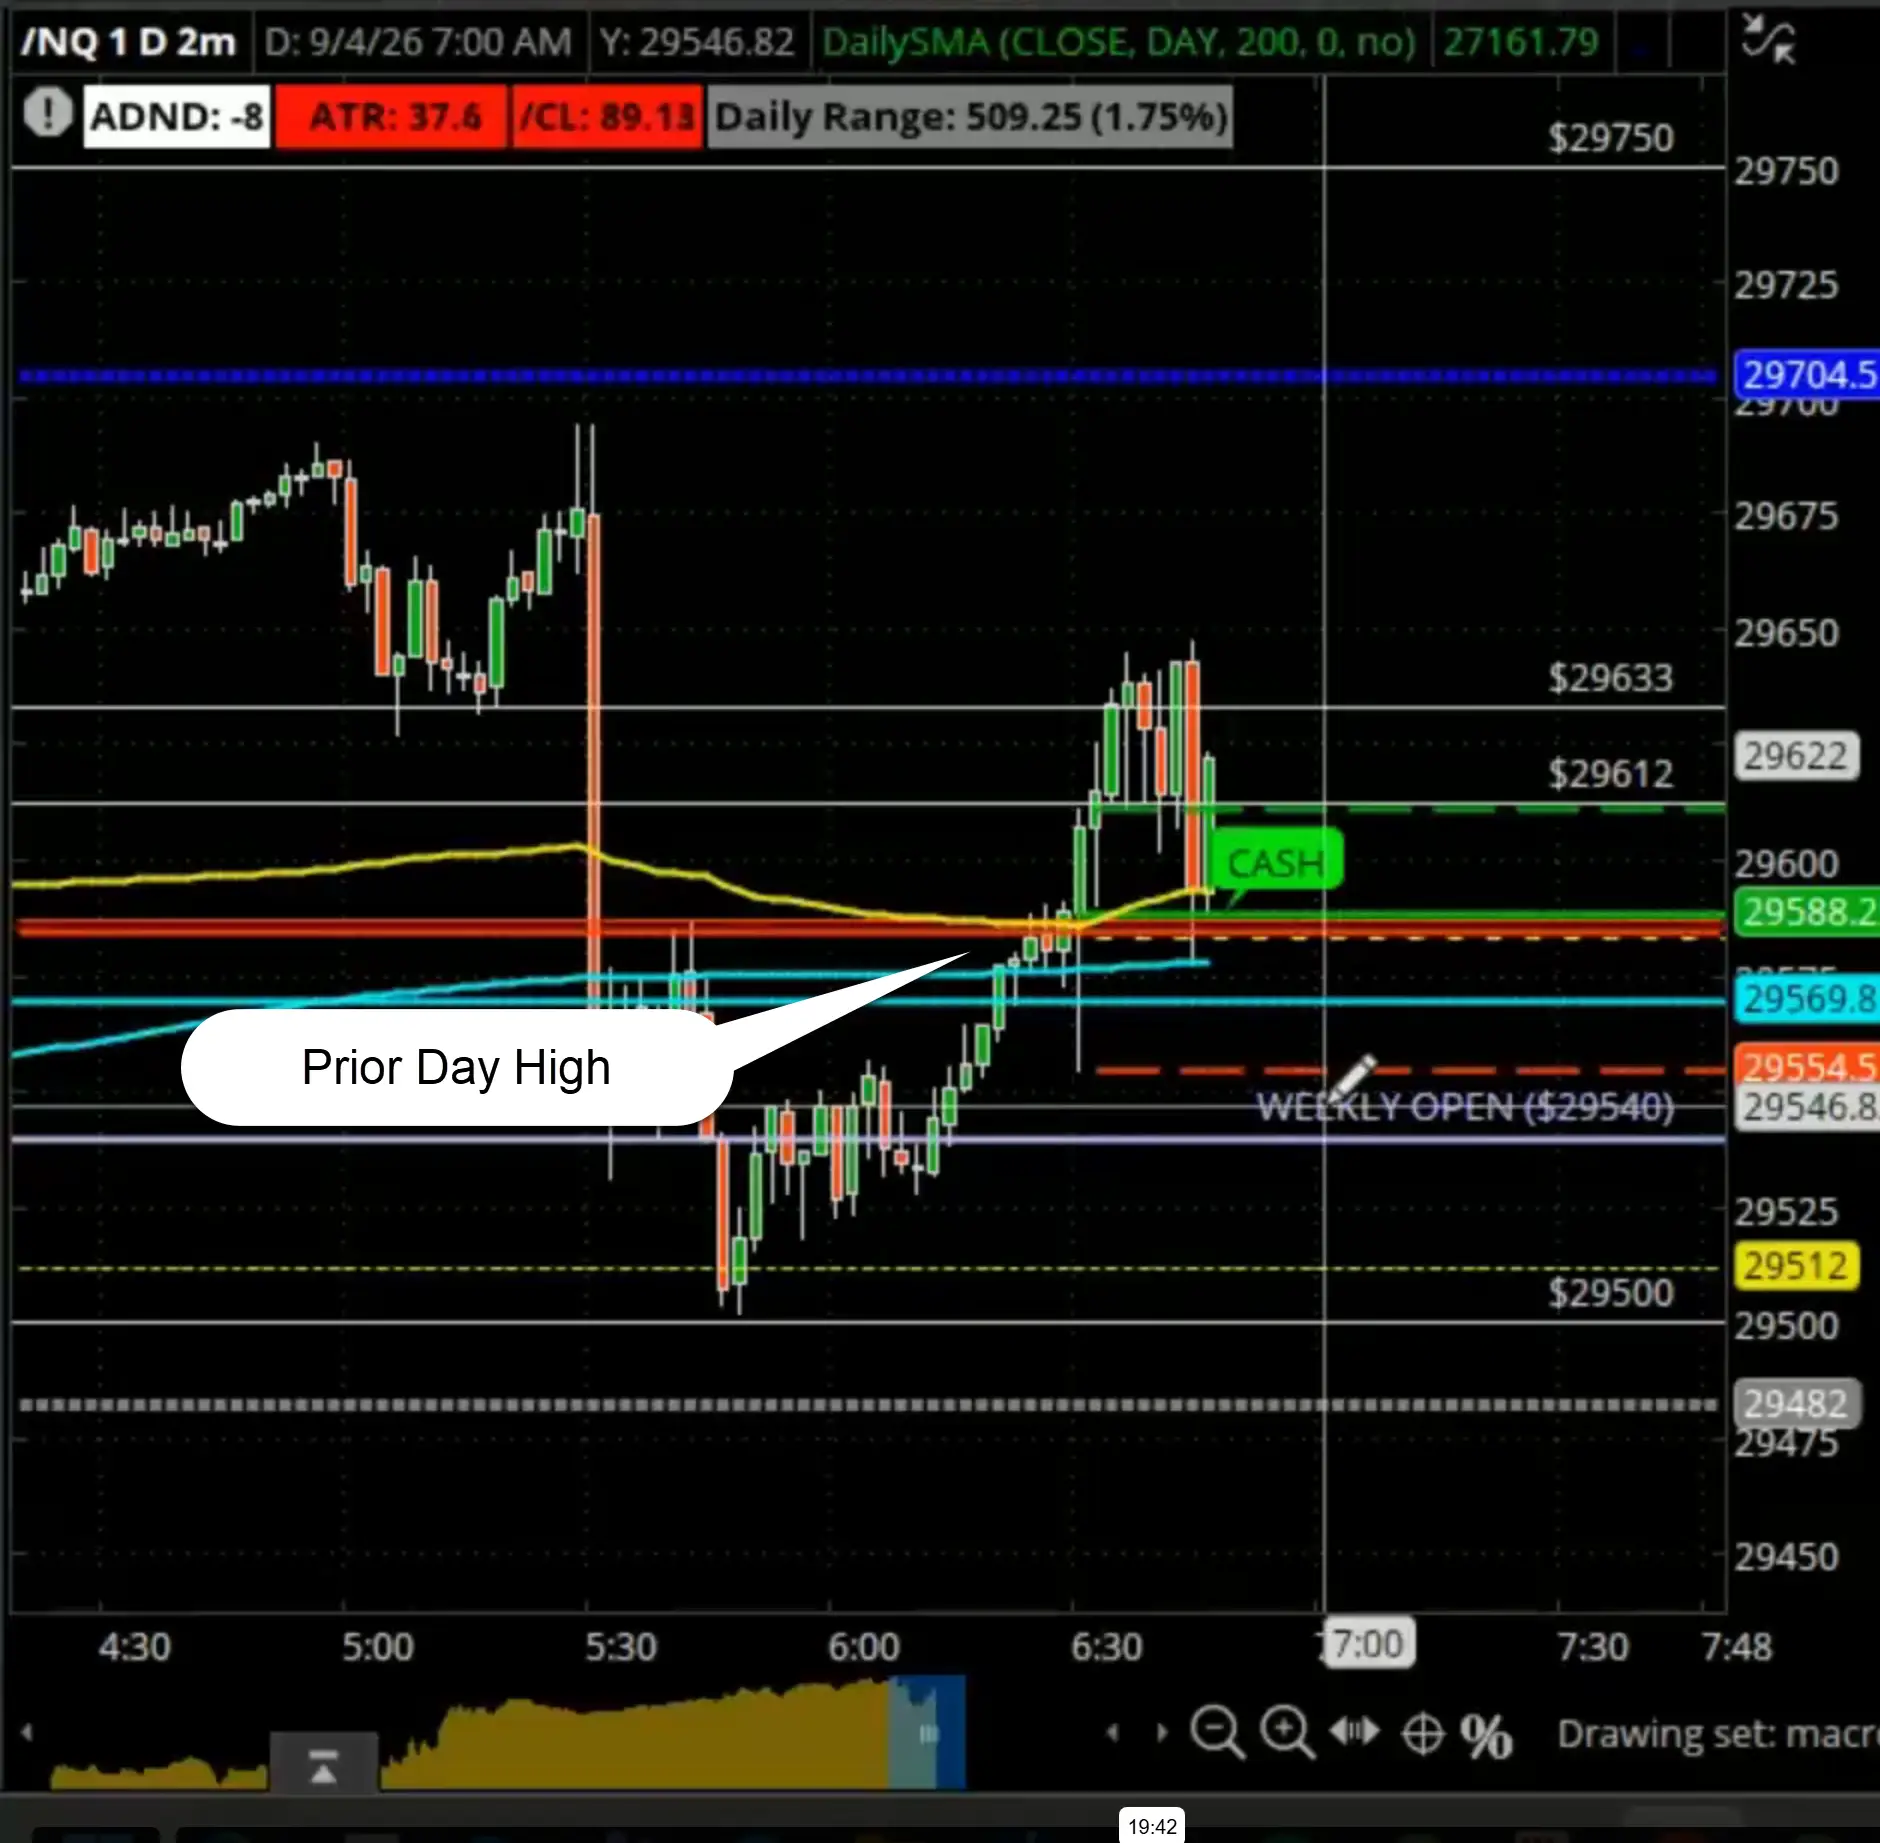
Price reclaimed a reference level a lot of people were watching. Above the prior day high, the character of the tape was no longer bearish.
I took it for plus 30 times three and left.
The weekly version carries more weight than the daily. The daily carries more than the hourly.
Do This Before Monday
Give yourself ten minutes this weekend.
Mark last week’s high and low on your trading chart, then add the midpoint and the 618.
Now go back through the last two months. Find every week where price traded through one of those extremes and note what happened on the reclaim attempt.
Count how often the reclaim held and how often it failed.
You’ll trust the setup a lot more once you’ve watched it work with your own eyes instead of taking my word for it.
One warning from experience. None of this occurs to you in the moment:
“This is the crap that when you’re in the throes of it, ticks are flying, it’s volatile, you’re not thinking about that.”
That’s precisely why the lines go on the chart before the session starts.
Looking Ahead
The bulls can’t just leave the tape where it is.
They need to go after a new all-time high, and they’re going to need some help to get there.
I think these levels matter for the next leg.
Mark the fresh weekly bar Sunday. Watch what price does the first time it revisits either end of it.
The full level map, the reclaim signals, and the bracket math I trade off every morning live inside my Golden Setup.
Trade smart,
Tony Rago
Creator of the Golden Setup