Hey trader,
Friday morning cost me $110 on a gold short that reversed and took my full stop.
The crude trade that same session risked $38 and returned $230.
Comparing the two: the loser risked nearly three times what the winner did.
That gap has nothing to do with being right more often. It comes from what you demand of a setup before you put money behind it.
Cutting risk is the easy half of the job…
Sizing the reward that sits behind it is where the account actually grows, and that’s the tenet the 10% club is built on.
And it’s particularly relevant when you’re starting out with a smaller account of, say $5,000.
With volume running near half of last year’s on Friday, these examples, both good setups, illustrate this point perfectly.
So, let’s go through both.
Two Trades, One Morning, Very Different Math
Friday sat between a non-farm payroll report and a three-day weekend. The volume never showed up for either one.
Last year the S&P 500 averaged 66 million contracts on September 3rd. This year runs 33 million, and Friday did not reach even that.
Both trades came off the same playbook.
Gold gave me a beacon breakout with a bearish divergence building underneath it.
Crude gave me a beacon long into a level I had flagged an hour earlier.
Gold risked $110 to make $300.
Crude risked $38 to make $224 at target, and it closed out near $230.
One paid under three dollars for every dollar at risk. The other paid six.
Gold Broke My Ceiling Before It Broke My Stop
I went short gold at 4472. The beacon stop sat at 4492, which put $200 on the line for a single micro.
The Parabolic SAR was rolling over. I tightened to 4483 instead, which brought the risk down to $110.
Two things were wrong with that trade, and only one of them was the ratio.
Every trade in the room runs off a $5,000 account at 1% to 2% risk. My ceiling is $50 to $100.
A $110 stop clears that ceiling on one contract. I knew it at the time and I took the trade anyway.
The ratio was the second problem. Thirty points of reward against eleven points of risk comes to 2.7-to-1, which is respectable enough that it never sets off alarms.
Respectable is where accounts leak. A 2.7 setup carrying oversized risk is a worse trade than a 6.0 setup carrying half the size, and the second one is available more often than traders think.
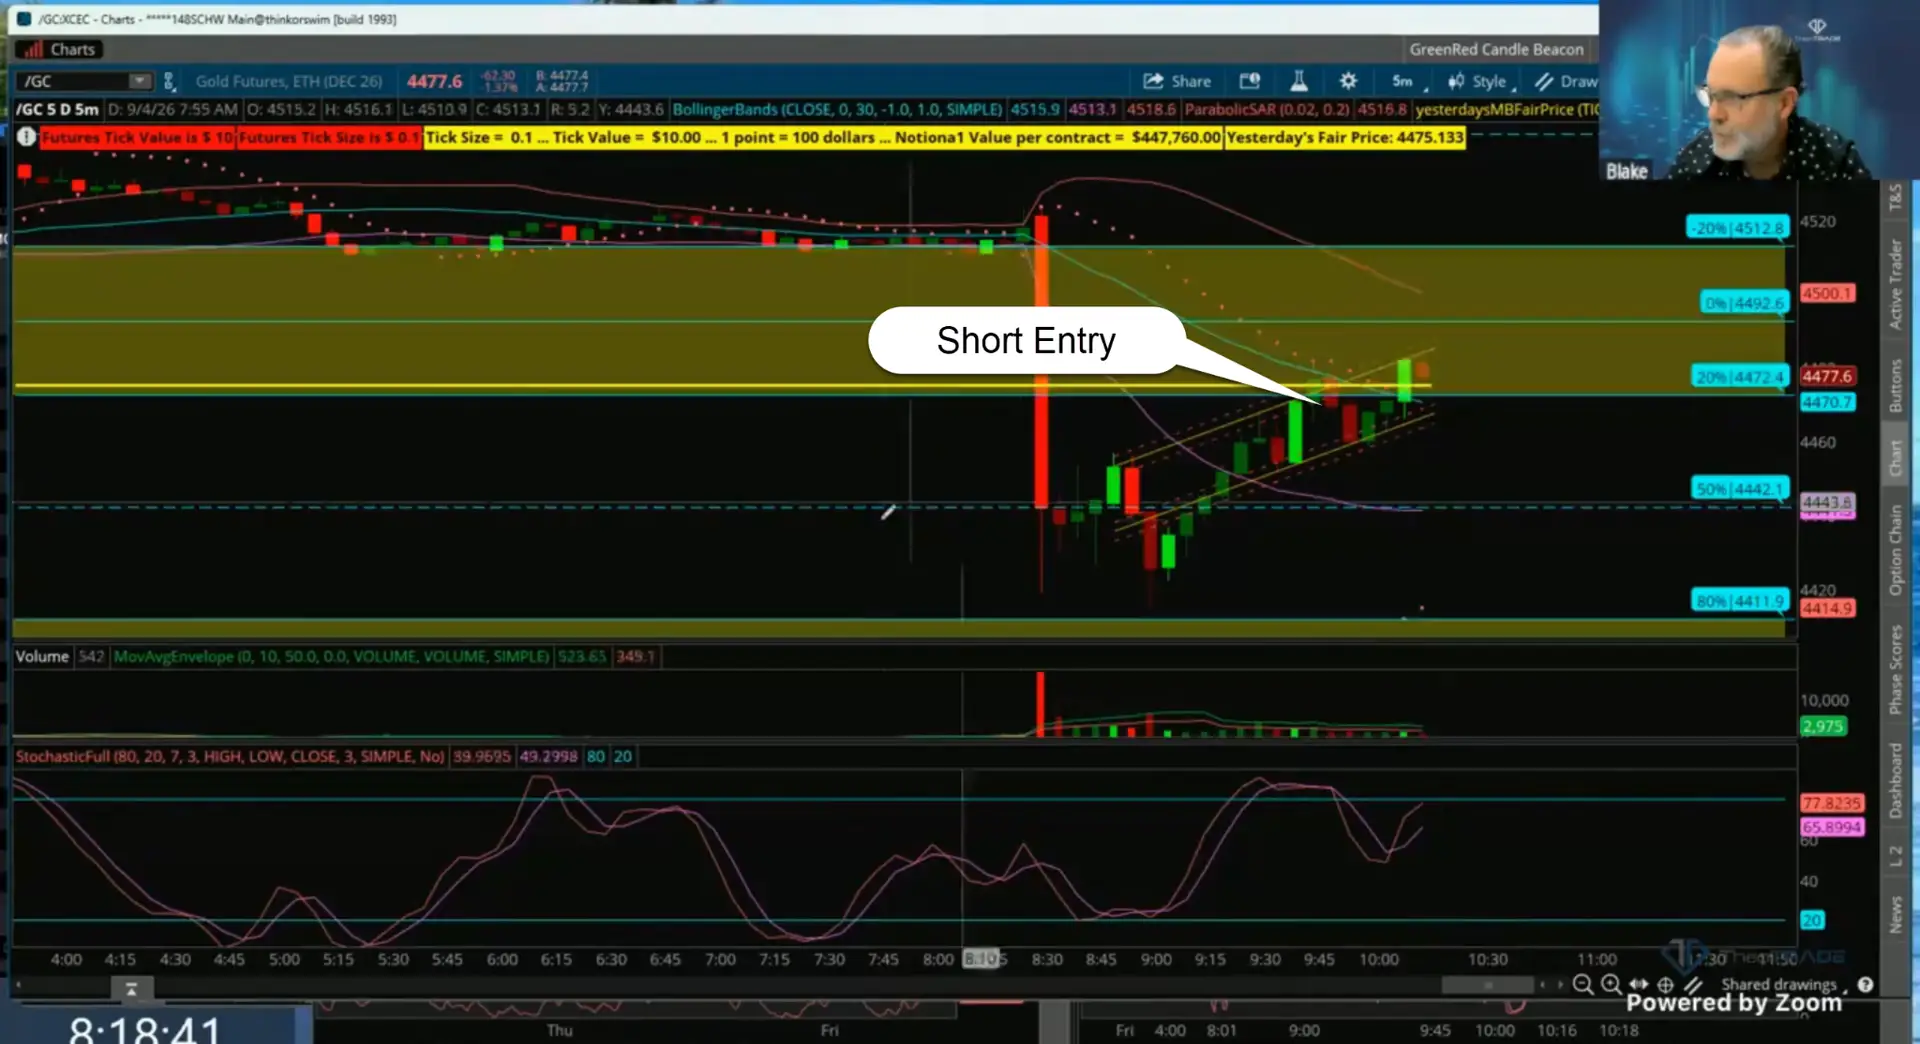
Price never reached the halfway mark. It reversed, retested the beacon zero, and ran through 4483.
I went back to the platform to argue about it. My honest first thought was that the stop had never moved, and I had to check the order to confirm that it had.
The stop was fine. My sizing was not.
Cutting The Risk Side On Crude
Crude sold off all night and kept going through the morning. It opened at 93.66 and worked toward 89.06, a level I called out early as worth watching.
When the beacon fired long, my first instinct was a stop at 88.98. That is $0.38 of risk, or $76 across two micros.
I waited for the pullback into the zero instead.
I bought at 89.09 and set the stop at 88.90, tucked beneath the low and beneath the zero line. Nineteen cents of risk, or $38 for two micros against a target of 90.21.
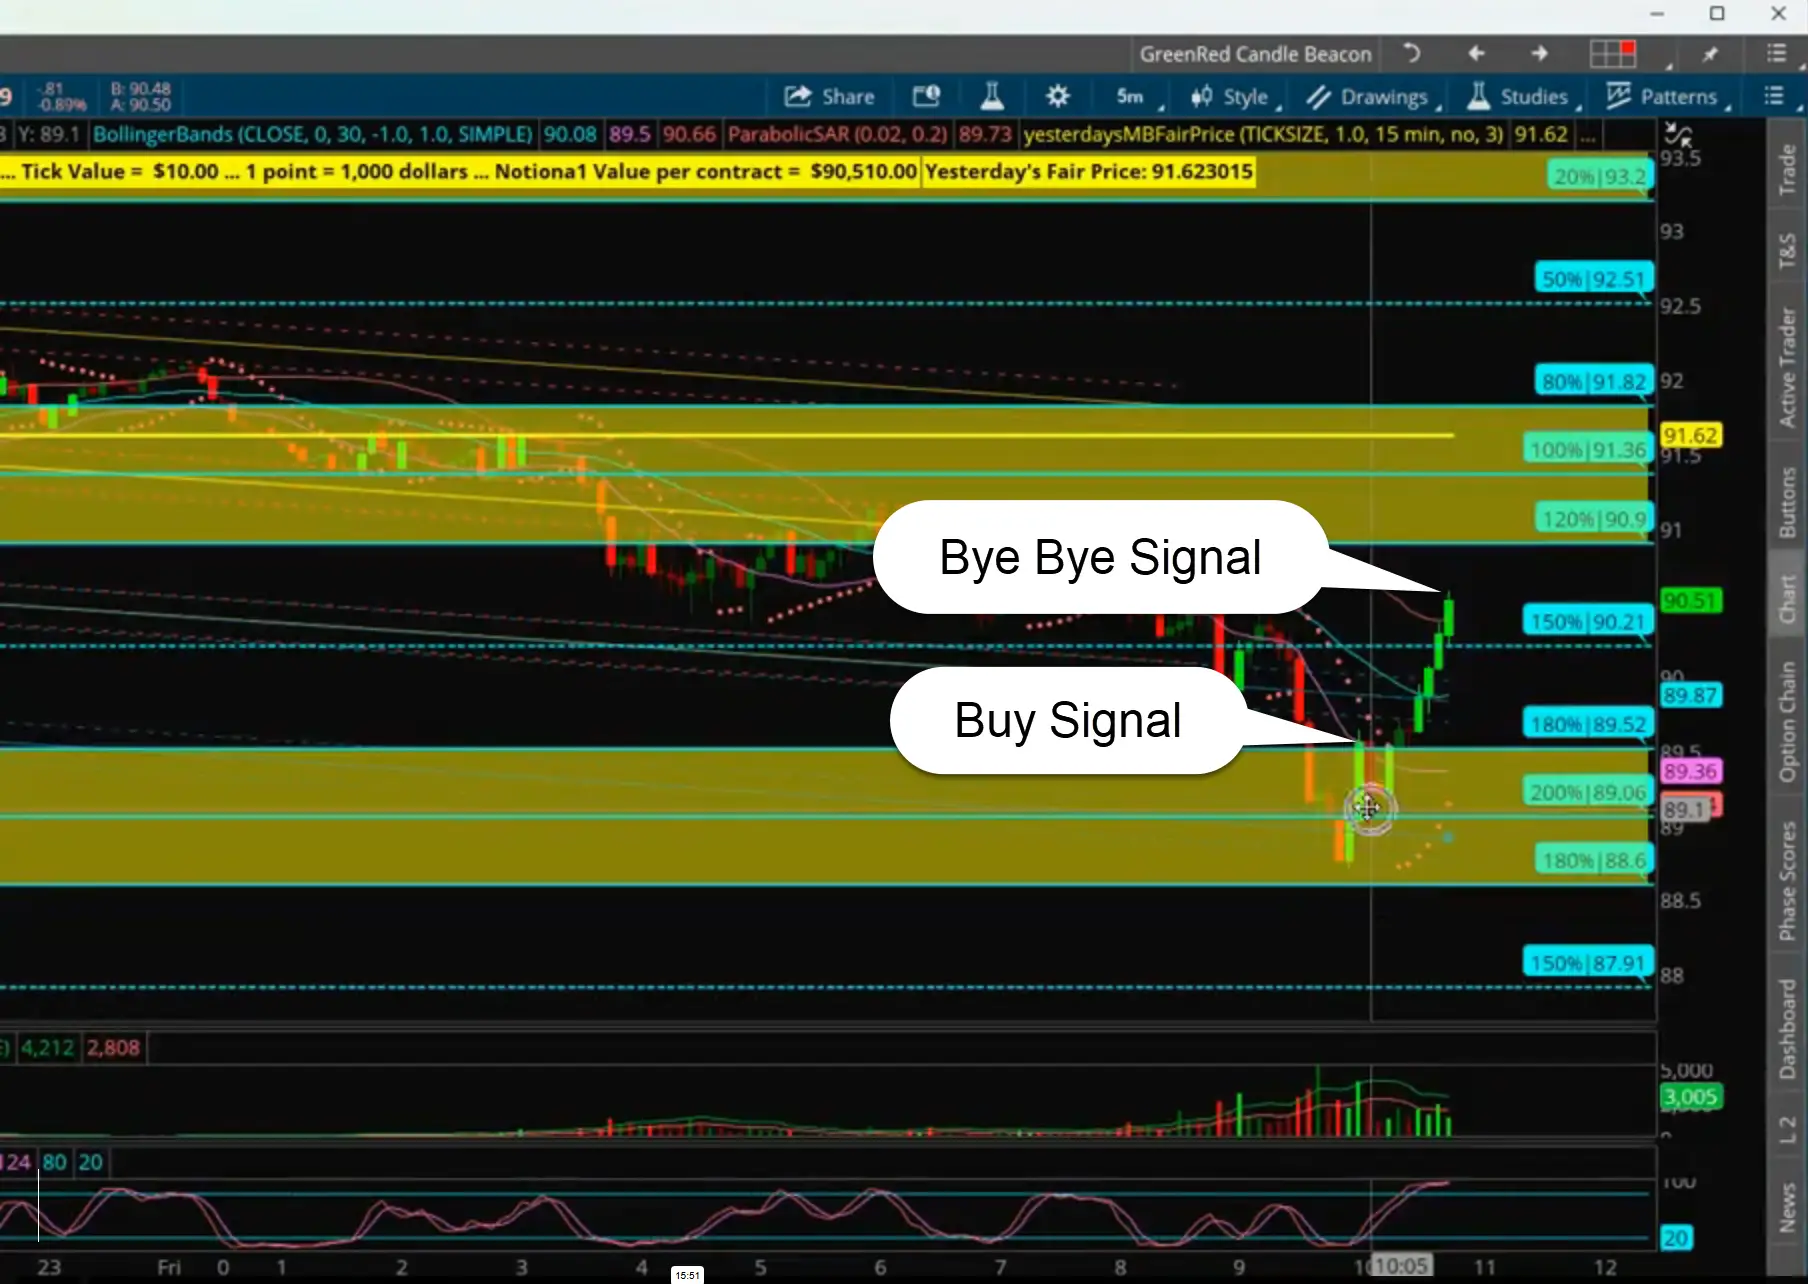
Waiting there is uncomfortable. Price had just printed a higher high and a lower low, and it genuinely feels like stepping in front of a reversal.
I told the room the same thing I will tell you. Do not FOMO into these and go big, because the size is the entire point.
A second beacon fired later at a close of 89.53. Its stop sat below 89.15, which is roughly double the risk for the exact same 90.21 target.
Both were valid signals. One bought twice the payout per dollar committed.
Adding To The Reward Side
Cutting the stop is one lever. The target is the other one, and it gets pulled far less often.
My beacon target was 90.21. The channel gives a second number above it.
I draw the channel from the 6:00 PM open at 91.67 using the beacon height of $0.92. When price clears a level, that slope duplicates and projects the next target.
On Friday that projection landed at 90.75. Holding for it instead of the beacon target was worth roughly $50 more per micro, or another $100 on the two contracts.
Knowing that number before entry changes what the trade is worth. A $38 risk against 90.75 is closer to 8-to-1 than 6-to-1.
I still took 90.21. Sellers were stacked overhead until 90.85, and Friday’s volume gave me no reason to believe a thin tape would push through them.
Crude tagged the target, ran to the monkey bar, and dropped straight back to fair price. Targets exist for exactly that sequence.
The extension is a decision you make before entry, not a hope you hold afterward. On a normal Tuesday with real volume, that same projection is worth holding for.
What This Means For You
Three moves you can run before your next entry.
- Write your dollar ceiling down before you open the chart. On a $5,000 account that is $50 to $100, and a setup demanding more gets fewer contracts rather than a bigger ceiling.
- Price two entries on the same target and take the cheaper one. My crude pullback at 89.09 risked half of what the 89.53 beacon risked for an identical 90.21.
- Find your second target before you enter. The channel projection at 90.75 turned a 6-to-1 trade into an 8-to-1 trade on paper, which tells you what the setup is actually worth.
Run those three and sizing stops being a judgment call. It becomes arithmetic you finish before the entry candle closes.
Your Next Step
Volume should return on Tuesday after the holiday. That gives you a clean place to start.
Pull your last ten trades. Write down the dollar risk and the reward-to-risk at entry for each one.
Circle every trade that broke your ceiling. Then circle every trade where a better entry or a further target would have moved the ratio, because that second list is the one nobody keeps.
Risk the small number, collect the big one.
Blake Young
Senior Market Strategist, TheoTRADE
Tokens used: roughly 6,700 total for this turn. The largest share came from loading the system instructions and user preferences (about 6,000), followed by reading the article document (about 1,100), with the response itself under 200.