
Hey Trader,
Trading price channels starts with the slope of the chart. Get it wrong, and you’ll buy stocks the machines are selling.
A stock that’s been sliding for weeks can start to look like a bargain. You buy it and wait for the bounce.
Meanwhile, the algorithms keep selling. On that chart, you’re the only buyer.
Corey Rosenbloom, Gianni Di Poce and I never buy downtrends. We don’t short uptrends either.
We let the chart’s slope pick our direction first. That’s the first rule of trading price channels.
A price channel is two parallel lines drawn around a stock’s price. Resistance sits on top, with support on the bottom.
Every stock sits in one of three channels. It’s either climbing, falling or moving sideways.
The machines move prices on a slope and an order flow. Trade without understanding channels, and you’re at a tremendous disadvantage.
Each channel tells you which trades you’re allowed to take. A sideways one tells you to wait.
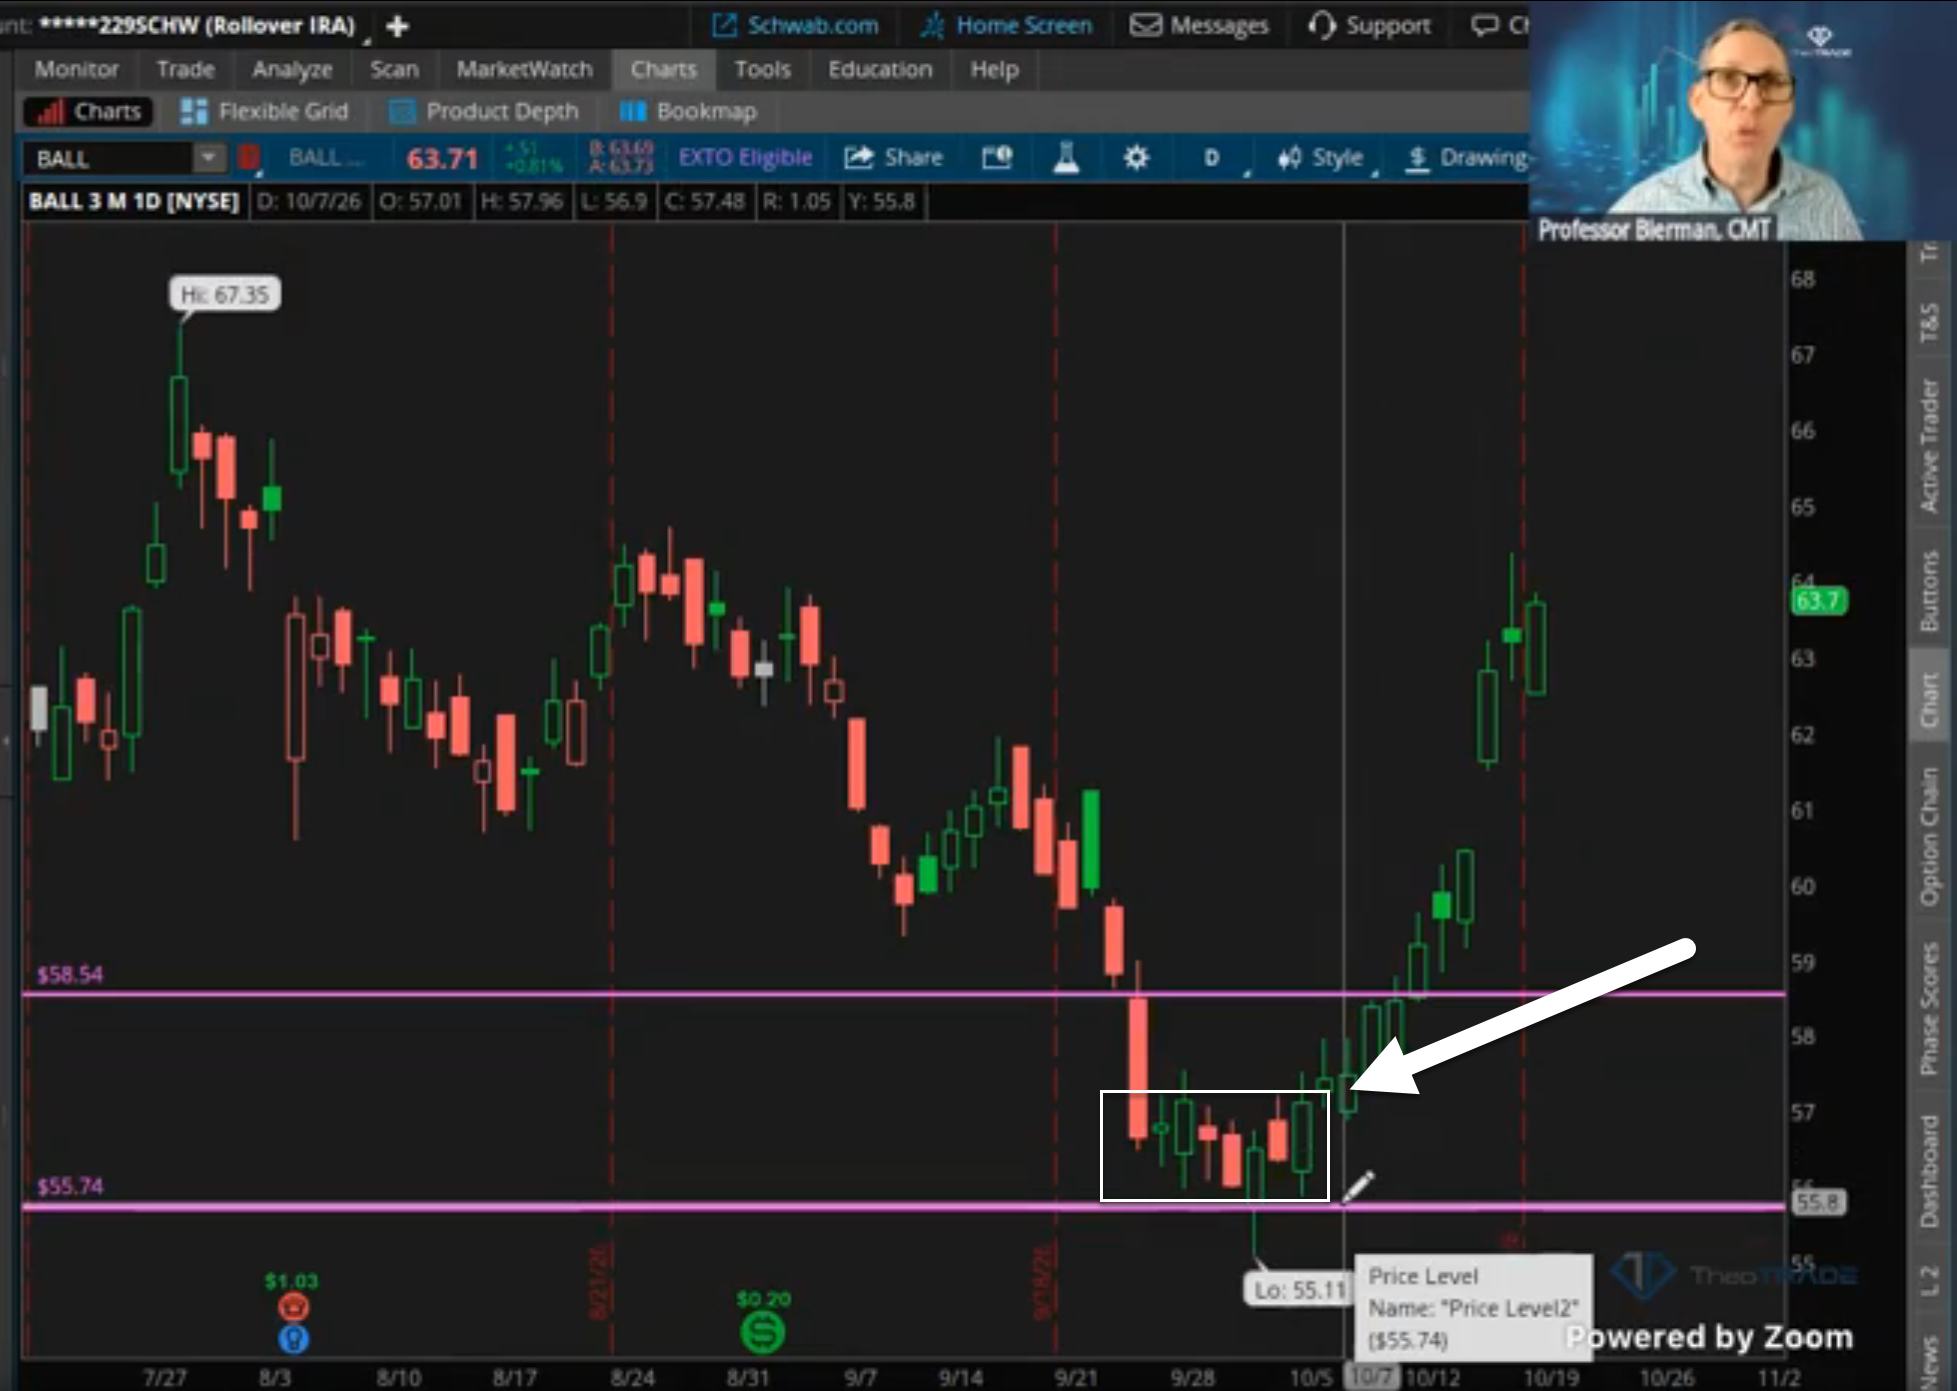
Last week, Ball Corporation was stuck in a sideways channel. I waited for the breakout, bought it and sold it Friday at 64.50.
Let me walk you through trading price channels in all three directions. Then I’ll show you how I decide which side to trade in each one.
How To Tell Which Channel You’re In
I call this lesson Freeze Frame, after the J. Geils Band song. A channel freezes the price action and frames it.
The market has plenty of volatility. Inside those swings up and down, there’s a pattern.
A channel captures that pattern with two parallel lines. The key word is parallel, since bands that bend never give you a hard line.
Trading price channels starts with drawing them correctly. I draw the upper line by connecting the highs.
Then I connect the lows over the same look-back for the lower line.
The top line is always resistance. The bottom line is always support, no matter which way the channel runs.
Support marks the spot where buyers have the upper hand. Each time price drops there, just enough buyers show up to lift it.
Trading price channels means sorting every chart into one of three types:
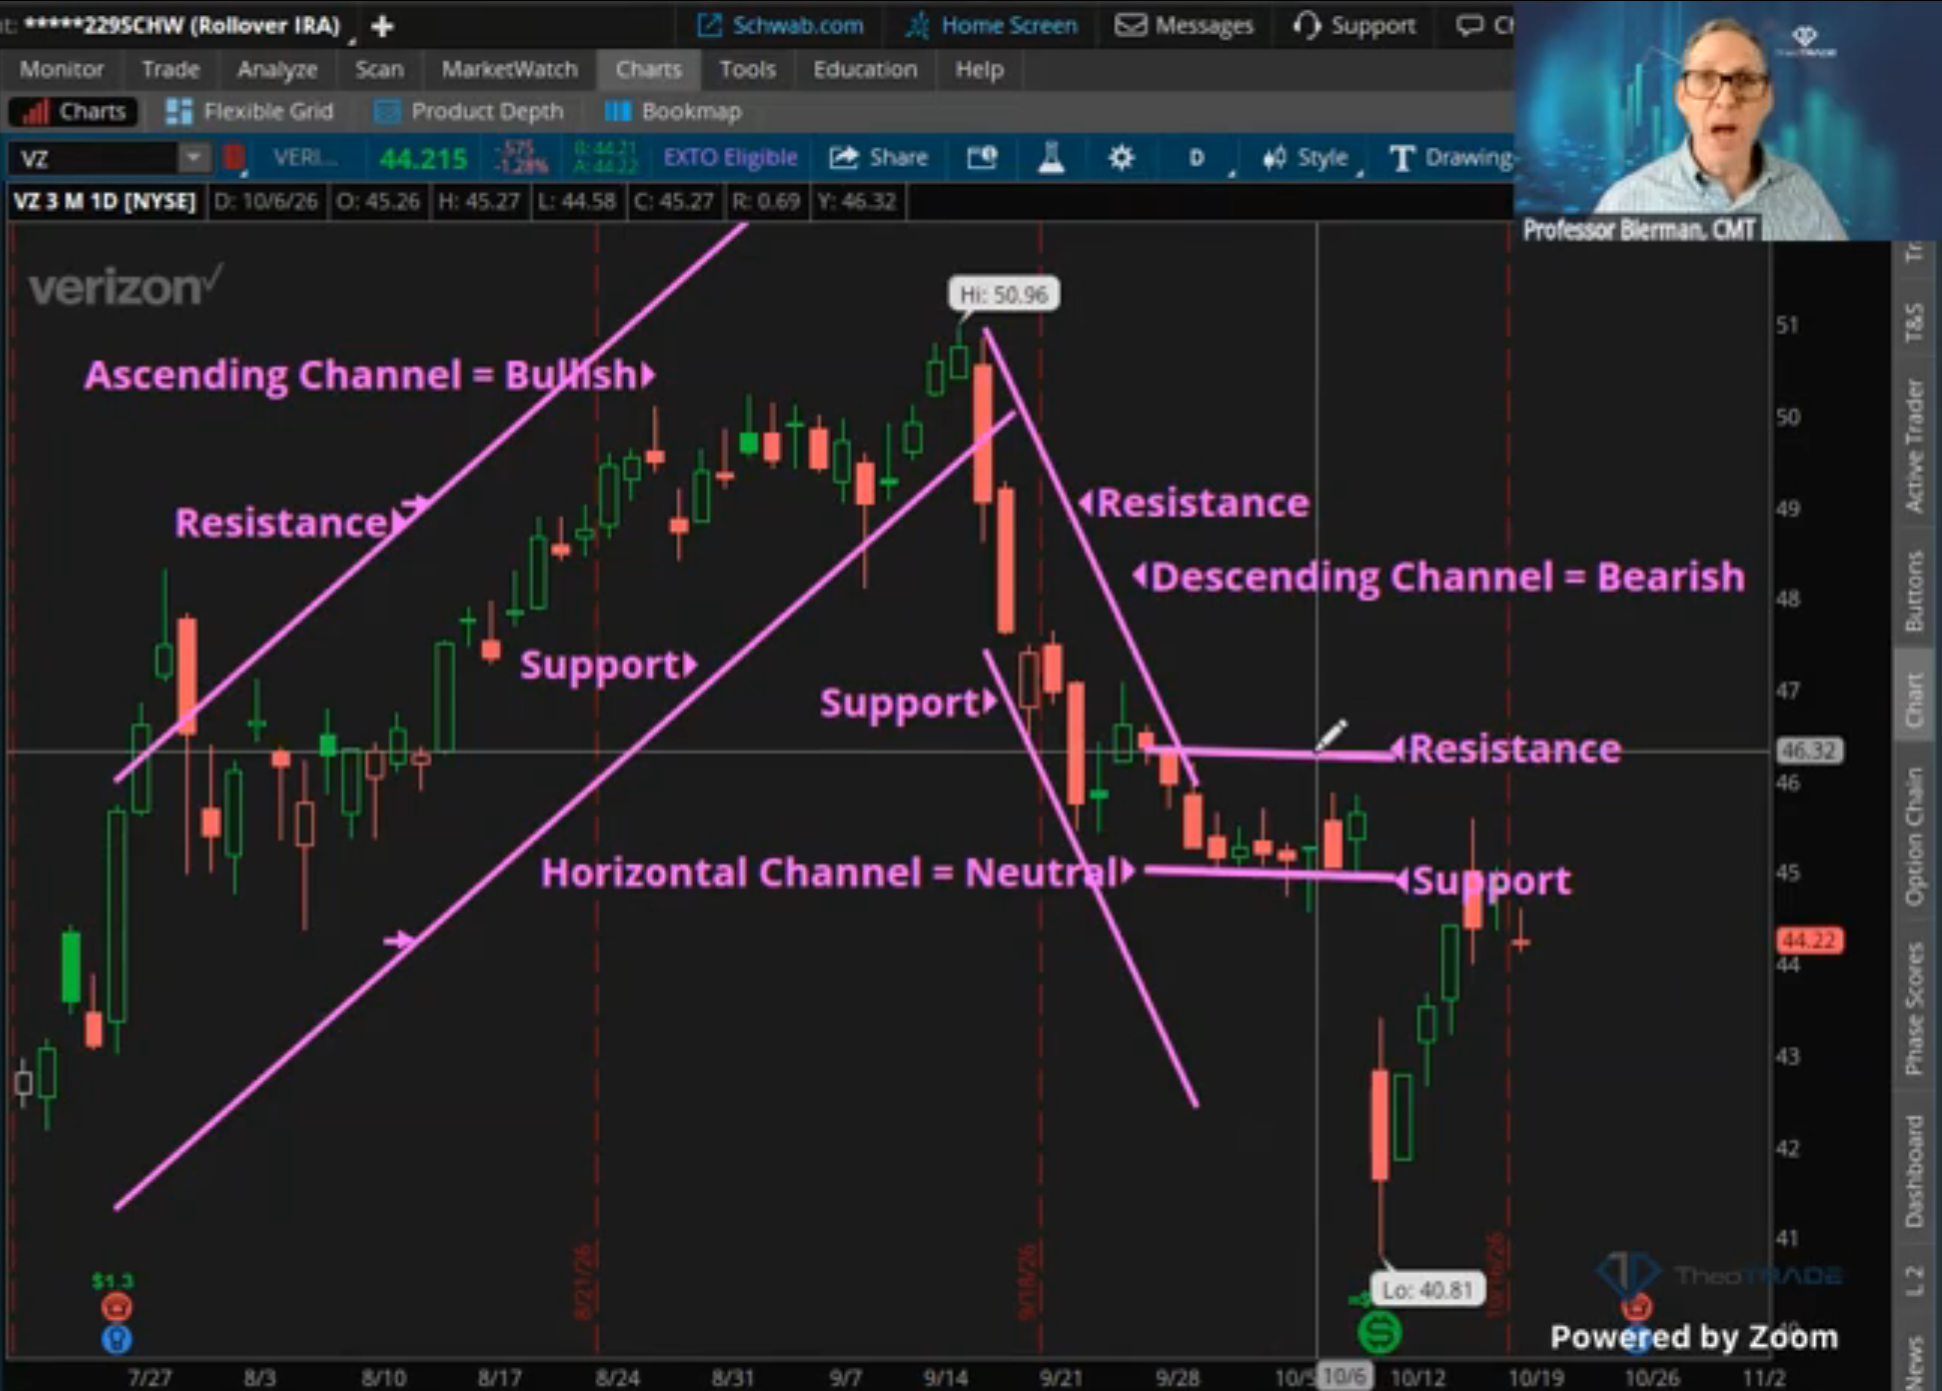
- Ascending. The stock makes higher highs and higher lows, which is bullish.
- Descending. The channel slopes downward, which is bearish.
- Horizontal. Price moves sideways. Don Kaufman calls it a volatility channel because the volatility stays contained.
Why The Slope Decides Your Direction
In an ascending channel, the path of least resistance points up. In a descending channel, it points down.
A horizontal channel has no trend at all. Neither side has an edge.
That slope matters most when you’re trading price channels. The machines care about it.
Everything they do runs on a slope and an order flow.
Buy a descending channel, and you’re stepping in front of algorithms that are selling. That’s a fool’s game.
Corey, Gianni and I don’t buy downtrends. We don’t short uptrends either.
Ascending and descending channels give the trade away. You trade in the direction of the trend.
Horizontal channels don’t give anything away. That’s why trading price channels sideways needs its own approach.
Trading Price Channels Up, Down And Sideways
In an ascending channel, I buy at or near the lower line. That’s the lowest-risk spot in an uptrend.
Buying near the top makes you a momentum trader. Buying at the bottom makes you a trend trader.
Corey always buys at the bottom of the trend. He rarely gets burned because of it.
If a trade fails near the bottom, you get out with minimal damage. Buy near the top, and you’re open to $3 or $4 of slippage.
A descending channel flips the rule. I only short, and I short at or near the top.
Being wrong at 47 beats being wrong at 45.50. Shorting up top gives me $1.50 of leeway.
You never buy the bottom of a descending channel. That’s where you become the only buyer.
Horizontal channels work differently. I make more money trading price channels sideways than any other way.
With no trend, I don’t assume the top line will hold. I wait for confirmation that the stock is breaking out or breaking down.
That’s how I traded Ball Corporation. Once it broke out of its sideways channel, I bought right on the breakout.
I sold it Friday at 64.50. I’ve been buying breakouts like that all year long.
How To Start Trading Price Channels On Your Next Chart
Markets move in segmented channels. They climb the ladder, pause, descend the ladder and pause again.
Trading price channels well means knowing which step you’re on before you trade. Run these three checks first:
- Start on a daily or weekly chart. Higher timeframes produce more stable channels. Intraday channels carry more noise.
- Pick a look-back that fits the pattern. Channels used to need 20 or 30 days. Now some last three months, and others last five days.
- Confirm with a few indicators. RSI, volume, MACD and moving averages help cut down on false breakouts.
You don’t need 30 indicators. Three to five will do the job.
Set your own look-back rule for trading price channels if it helps. A 20-day minimum works fine.
A channel won’t predict the next move. It frames the move so you can trade with it.
Once you can frame price, you start to see man versus machine clearly. You see how the machines move prices up and down.
I still don’t rely on trading price channels alone. Every trade has to fall into my system, both fundamentally and technically.
Professor Jeffrey Bierman
Creator of the Genesis COG System