
Hey Trader,
On Monday, the 77 had already paid twice.
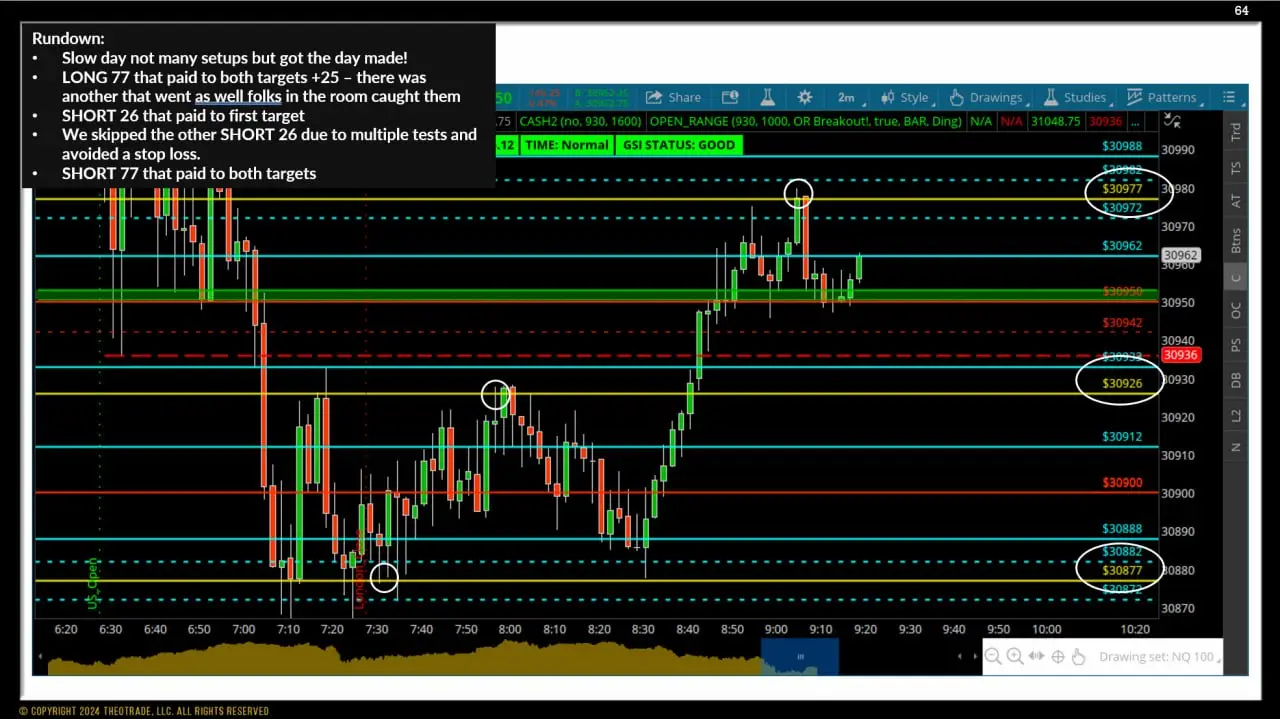
As price drifted back toward it, I asked the room how badly they wanted a third win.
“Are we really trying to get a third one? Your answer is yes, then maybe just chill out just a little bit, because the answer should be no.”
Support and resistance levels work. You get into trouble when you treat a level as equally strong every time price comes back to it.
Each test uses up some of the orders holding that level in place. Hit it enough times, and price pushes right through.
I count the tests on support and resistance levels before I trade them. That count tells me how much I can trust a level and how I should enter.
Counting tests takes some practice, especially when price keeps bouncing around a level. I’ll show you exactly how I do it, including what I count as a test and when I start back over at zero.
Once a level has been hit a few times, I change how I get into the trade. That change kept us out of a minus 30 on Monday, and I’ll walk you through how it played out.
Why Support and Resistance Levels Wear Out
My support and resistance levels repeat inside every 100-point block on the NQ. A 26 sits 26 points above a round number, which I call the roundy, with the 33 above it and the 12 below.
Support and resistance levels hold because orders are sitting there. When price keeps coming back to the same spot, I start asking whether those orders are still around.
“Why does price keep coming back here? Whatever passive buyer is sitting down here could be out of their orders. They could push through this thing.”
I’ve got a short way of saying it. Persistence beats resistance.
I described the temptation to the room as a cookie jar.
“Our hands in the cookie jar. Oh, cookies, cookies, cookies. And now you’re going to get your hands smacked because you’re spending too much time in that cookie jar.”
How I Count Tests on Support and Resistance Levels
A test only counts when price arrives at the level from at least 10 points away. A drift of six or seven points into the level doesn’t qualify.
To find the tests, I look left on the chart. I stop counting when I hit a big bar, because nothing behind it matters.
“You see this big bar that acts like a wall. You just bump your head into it. You can’t look through this. Even if you’re Superman, you’re not going to see through that.”
The count goes back to zero once price travels 10 points or more past the level. It also resets when price carries all the way through to the next level.
Once price moves that far away, the level gets a fresh start. I treat the next visit as a first test.
I won’t pretend this clicks on day one. “It’s the most difficult thing to understand. And once it clicks, you won’t forget it.”
How the Count Changes My Entry
A first test gives me my best odds, even when I have to take some heat. On a first test with the trend, I’m comfortable leaving a resting order at the level.
Later tests on support and resistance levels make me more careful.
“What we see in our homework often is that third test and fourth test will fail.”
On a third test, I pull my resting orders and use a back-through entry. Price has to push past the level and turn back before my order picks me up.
By the fourth and fifth tests, I’m usually passing.
“We don’t take the fifth test. We don’t take the fourth test. We may modify our entry process. It’s still a setup.”
The Golden Setup is my exception. I’ve watched it hold five, six and seven times.
The 26 I Wouldn’t Rest an Order On
Monday’s 26 shows the whole process. I counted the tests out loud on the chart, and the level was heading for its fourth or fifth.
On a short 26, the 33 is the level that has to hold. My emergency stop sits 15 points above my entry, but a break of the 33 tells me the idea is in trouble.
I let price reach the 33 first. If it turned back down, my order would sell it as it came back through the 26.
I told the room the trade was dead if price reached the 36. The 36 printed, and I flattened before my order ever filled.
“See how we avoided a minus 30 there, a minus 15 on our contracts?”
The level had been hit so many times that it finally gave out. Then I pointed at the chart to show the room what had happened to it.
“Look at all of this resistance right here has potentially flipped to support.”
The orders that had been capping price were gone. That’s how support and resistance levels can trade places once they break.
If price came back down to the 26 from the 50, that broken resistance would set up a Golden Setup long.
Signs Support and Resistance Levels Are About to Break
The count gives me a level’s history. Price action on the way in tells me how much pressure is building.
On Wednesday, I pointed out wicks reaching toward the 26 without ever touching it.
“This wick came here and went here, this wick came here and went here. So it’s building pressure to potentially push through.”
Speed matters too. I trust a quick arrival in one bar more than a slow grind that takes several bars to reach the level.
Wednesday’s homework also had a short 77 that ran against us and let us out early for a small loss. I told the room we never would’ve taken it live, because 77 and 82 had both been tested again and again.
Put a Number on Every Level
Before you trade support and resistance levels, count their tests and write the number next to each one on your chart. That number decides your entry before price gets there.
Use a resting order only on a first test with the trend. From the third test on, make price prove itself with a back-through. Skip the fifth test unless it’s a Golden Setup.
Keep grading every setup in your homework, whatever its count. Add the count to each entry, and a few weeks of notes will show you how your first tests stack up against your fourth.
Before the open on Monday, look left at all your support and resistance levels. Write down how many times each one has already been hit.
The 77 paid twice this week, and I took what it gave me. After that, I kept my hand out of the cookie jar.
Counting tests is one piece of how I trade the Nasdaq. Inside the Golden Setup, you get the whole system I used this week:
- My levels on your chart every morning. Auto-Charting plots the 26s, 33s, 50s and 77s for you, so you’re counting tests on the same map I trade from.
- The GSI, the indicator I built to tell me when to sit out. It’s why the room skipped Thursday’s 44 ATR. As I told the traders that morning, “As a whole, when we have a GSI red, it saves us money.”
- The onboarding videos. That includes the test count lesson I tell new traders to watch three or four times, and the homework tutorial where I show you how to check my rules for yourself.
- A seat in my live Golden Setup room. I’m in there at 10:30 a.m. ET every trading day, counting tests out loud and walking through every entry, every cancel and every exit.
- Coaching calls. These are where I teach the back-through and the more advanced entries once you’ve got the basics down.
On Monday, the test count kept us out of a minus 30. Inside the room, you’ll watch me make that call live, and you’ll learn to make it yourself.
Trade smart,
Tony Rago
Creator of the Golden Setup