Hey trader,
Every pullback in an uptrend has what I call a “depth limit.”
Yet the average trader has no idea where to find these support levels.
They’ll try everything from moving averages to volume profiles. Don’t get me wrong, those tools have merit.
I can show you how to find the key support simply by using Fibonacci retracement levels. Most trading platforms already include the tool.
However, that’s only one part of the equation. Price can crash right through a level.
You have to know how to read the support as well. Both skills tell you when to stay in a trade and when to step aside.
Monday’s market illustrates this point perfectly.
Nasdaq futures cratered right into the first line I was watching.
As I said, I care just as much about how price behaves once it gets there.
Let me show you how to identify the levels first. Then we’ll see how to read them using Monday’s chart.
How I Use Fibonacci Retracement Levels to Find the Depth Limit
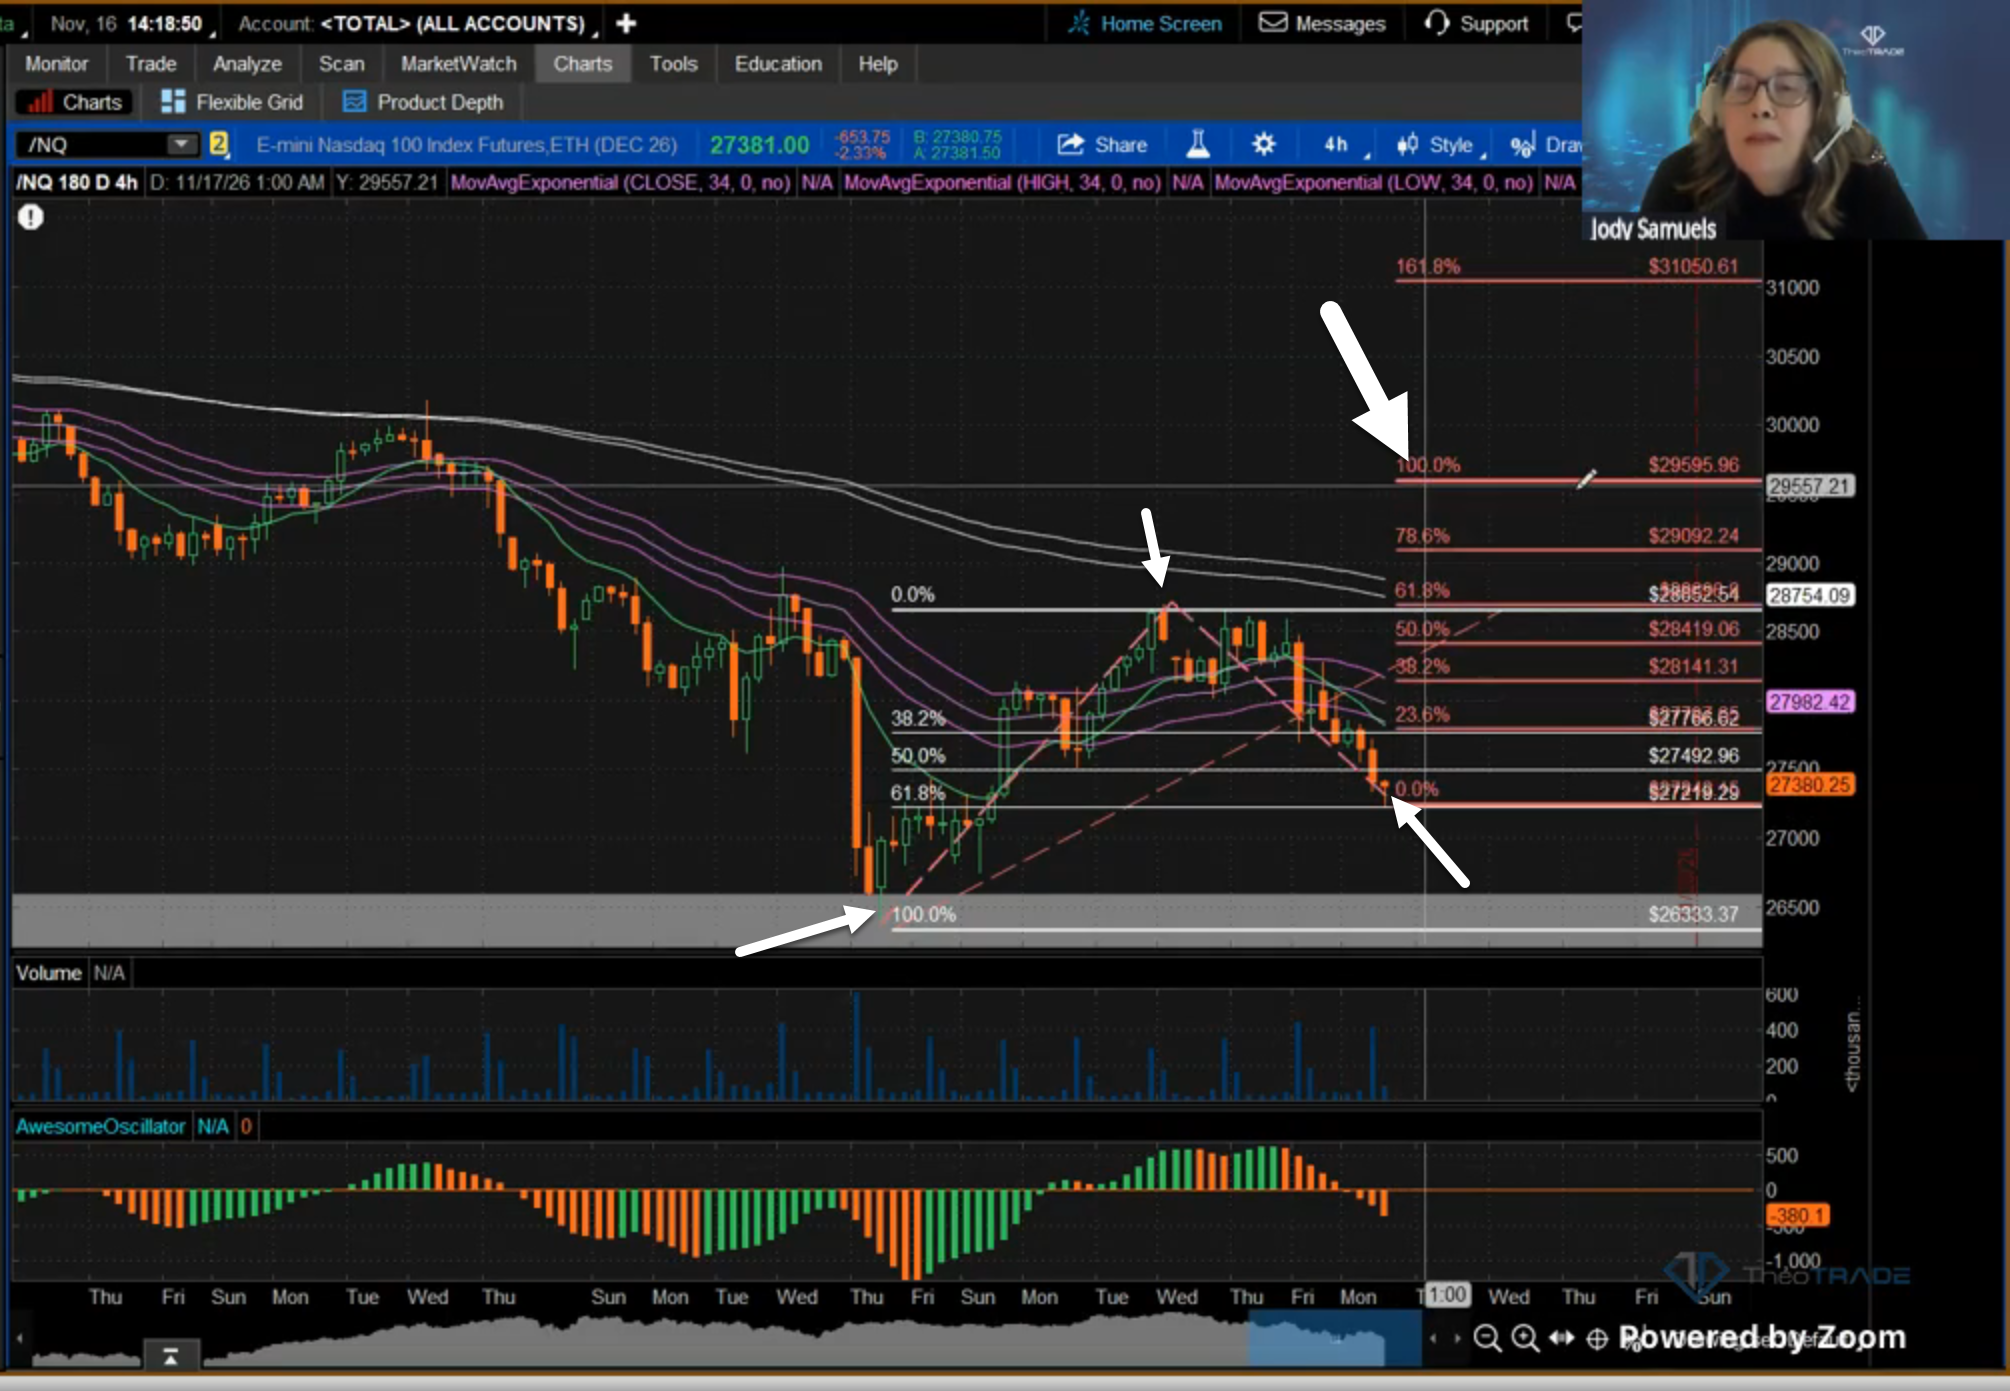
The Nasdaq set up a classic pattern from my Market Map. Price climbed in five waves, then pulled back in three.
A three-wave pullback after a five-wave climb can set up a reversal back up.
I measure how far that pullback can go with Fibonacci retracement levels. I draw them from the low of the move up to its high.
The tool marks each level for me. Three marks on that grid tell me where the depth limit sits:
- The 61.8% level is my first line. I’d like to see a pullback stop here.
- The 78.6% level is my second line. Price can go this deep and still hold the trend.
- The prior low is the floor. A break below it tells me price is going to test lower.
How I Read Price at Fibonacci Retracement Levels
I watch the candles closely when price reaches one of my Fibonacci retracement levels.
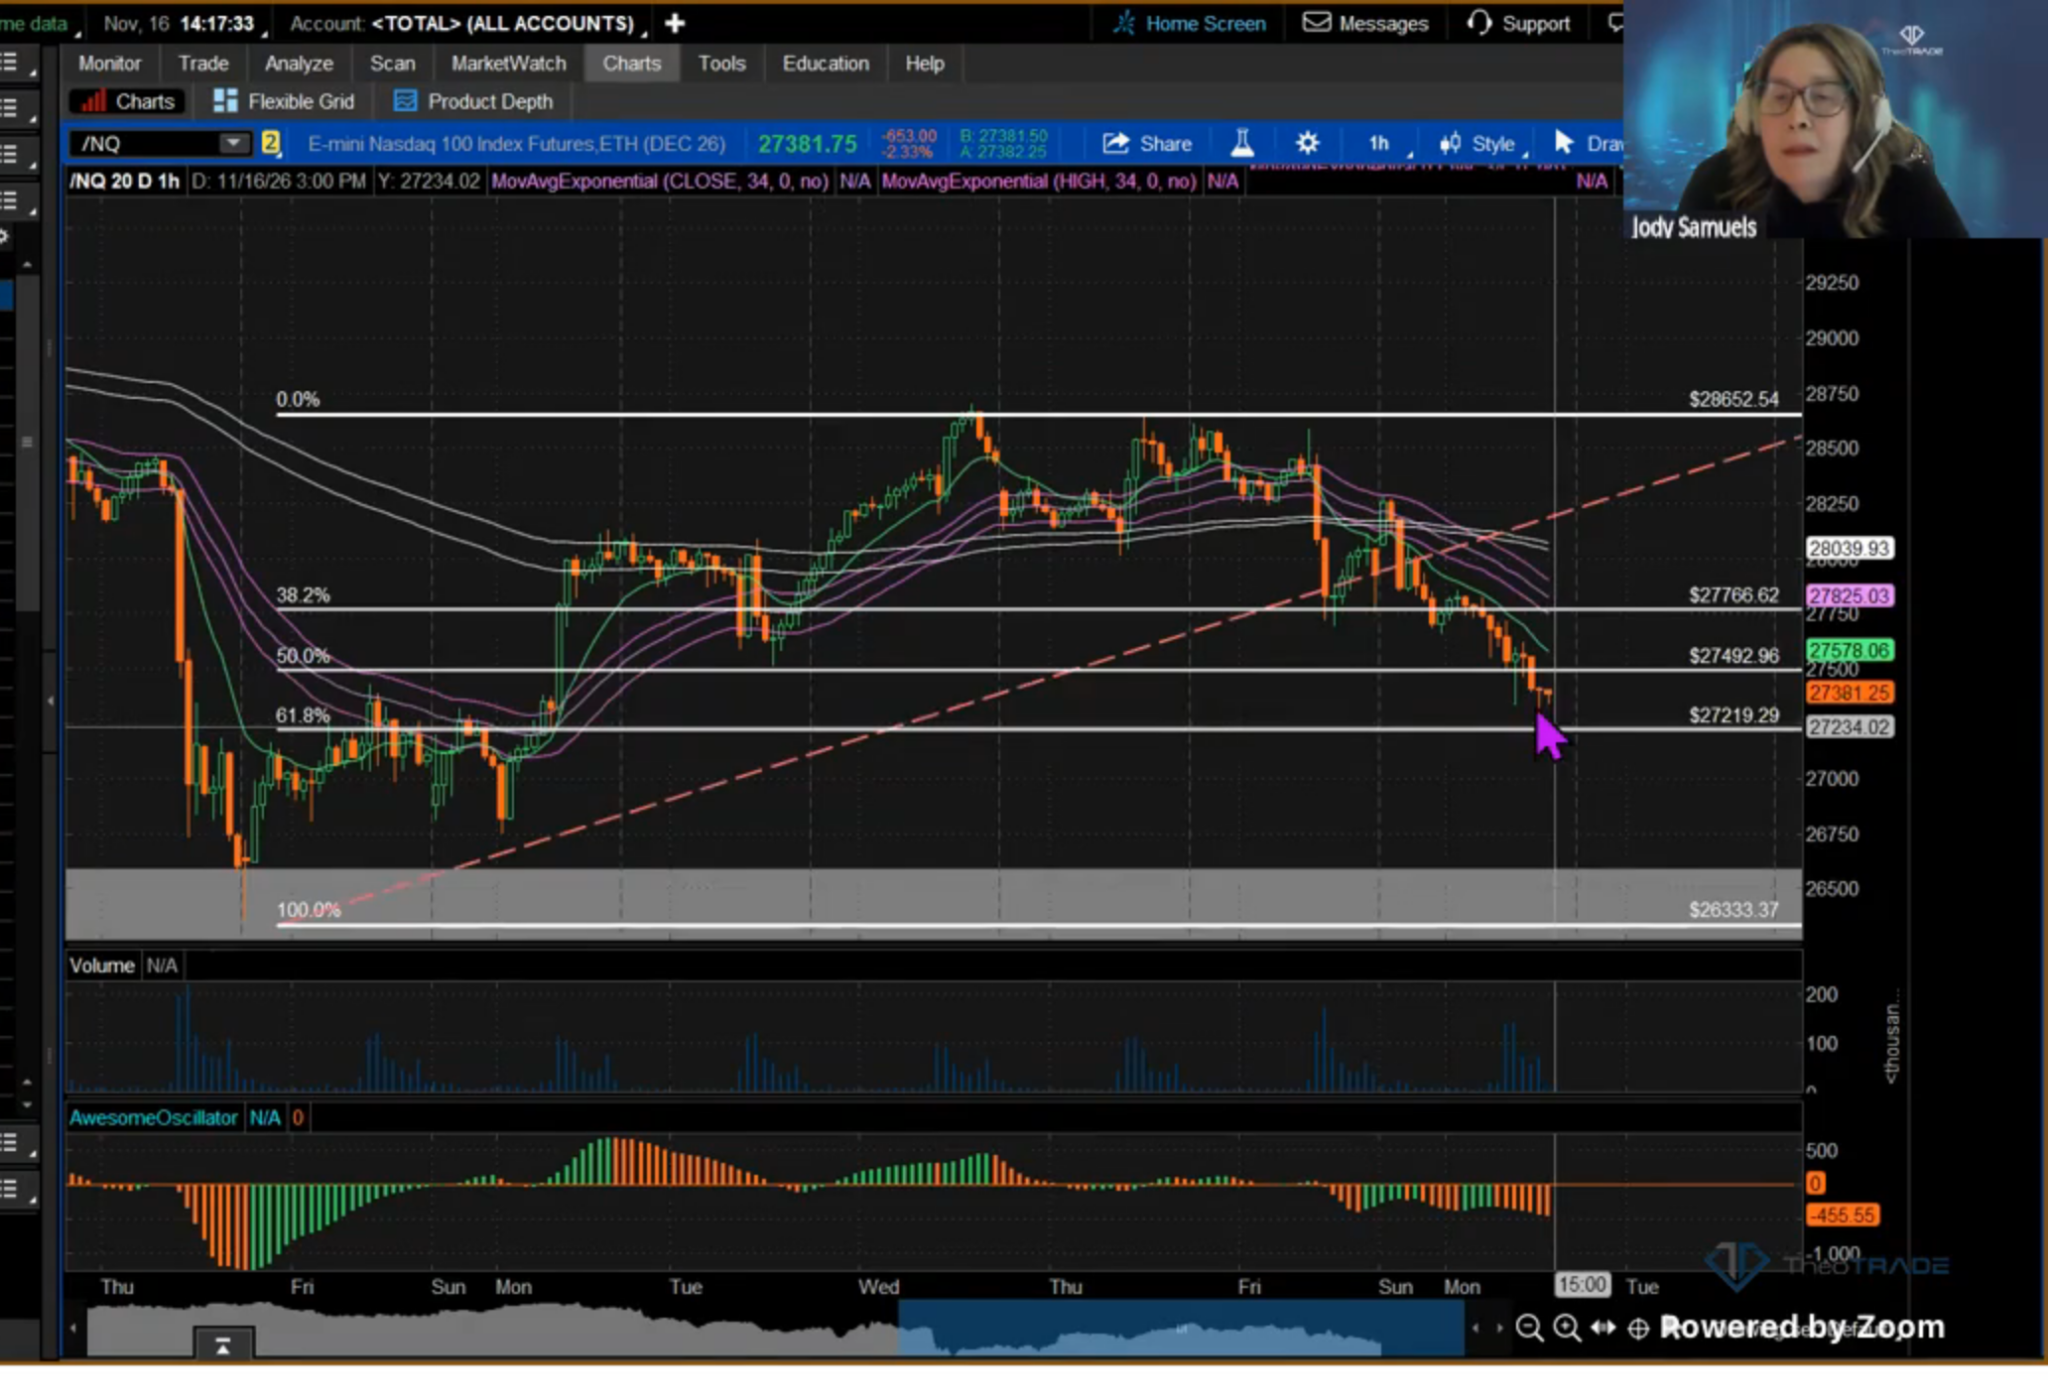
Nasdaq futures stopped right at 61.8% on the hourly chart Monday and printed a hammer candle.
A hammer has a long tail at the bottom. Sellers drove price down during that hour.
Buyers then took control. The candle closed in its top 25%.
That’s a bullish sign. I still want price to take out the hammer’s high before I trust it.
I hold my Dunk Alerts to the same rule. A stock has to dunk below its long-term trend, hold and then turn before I take the trade.
A break above the hammer’s high would point to a measured move, which copies the size of the last swing up. That projects the NQ up to 29,600.
I also compare the other indices at the same Fibonacci retracement levels.
The QQQs slipped just below 61.8%. I really don’t want them to lose 78.6%.
The S&P 500 held up better than the Nasdaq. Tech and AI stocks are carrying most of the weakness.
What Happens When the Limit Breaks
Bitcoin shows the other side of the rule. I measured its weekly chart with the same Fibonacci retracement levels, from the low of its last move up to the high.
It’s already given up 61.8% and sits close to 78.6%. I’ll be honest, I didn’t anticipate this drop.
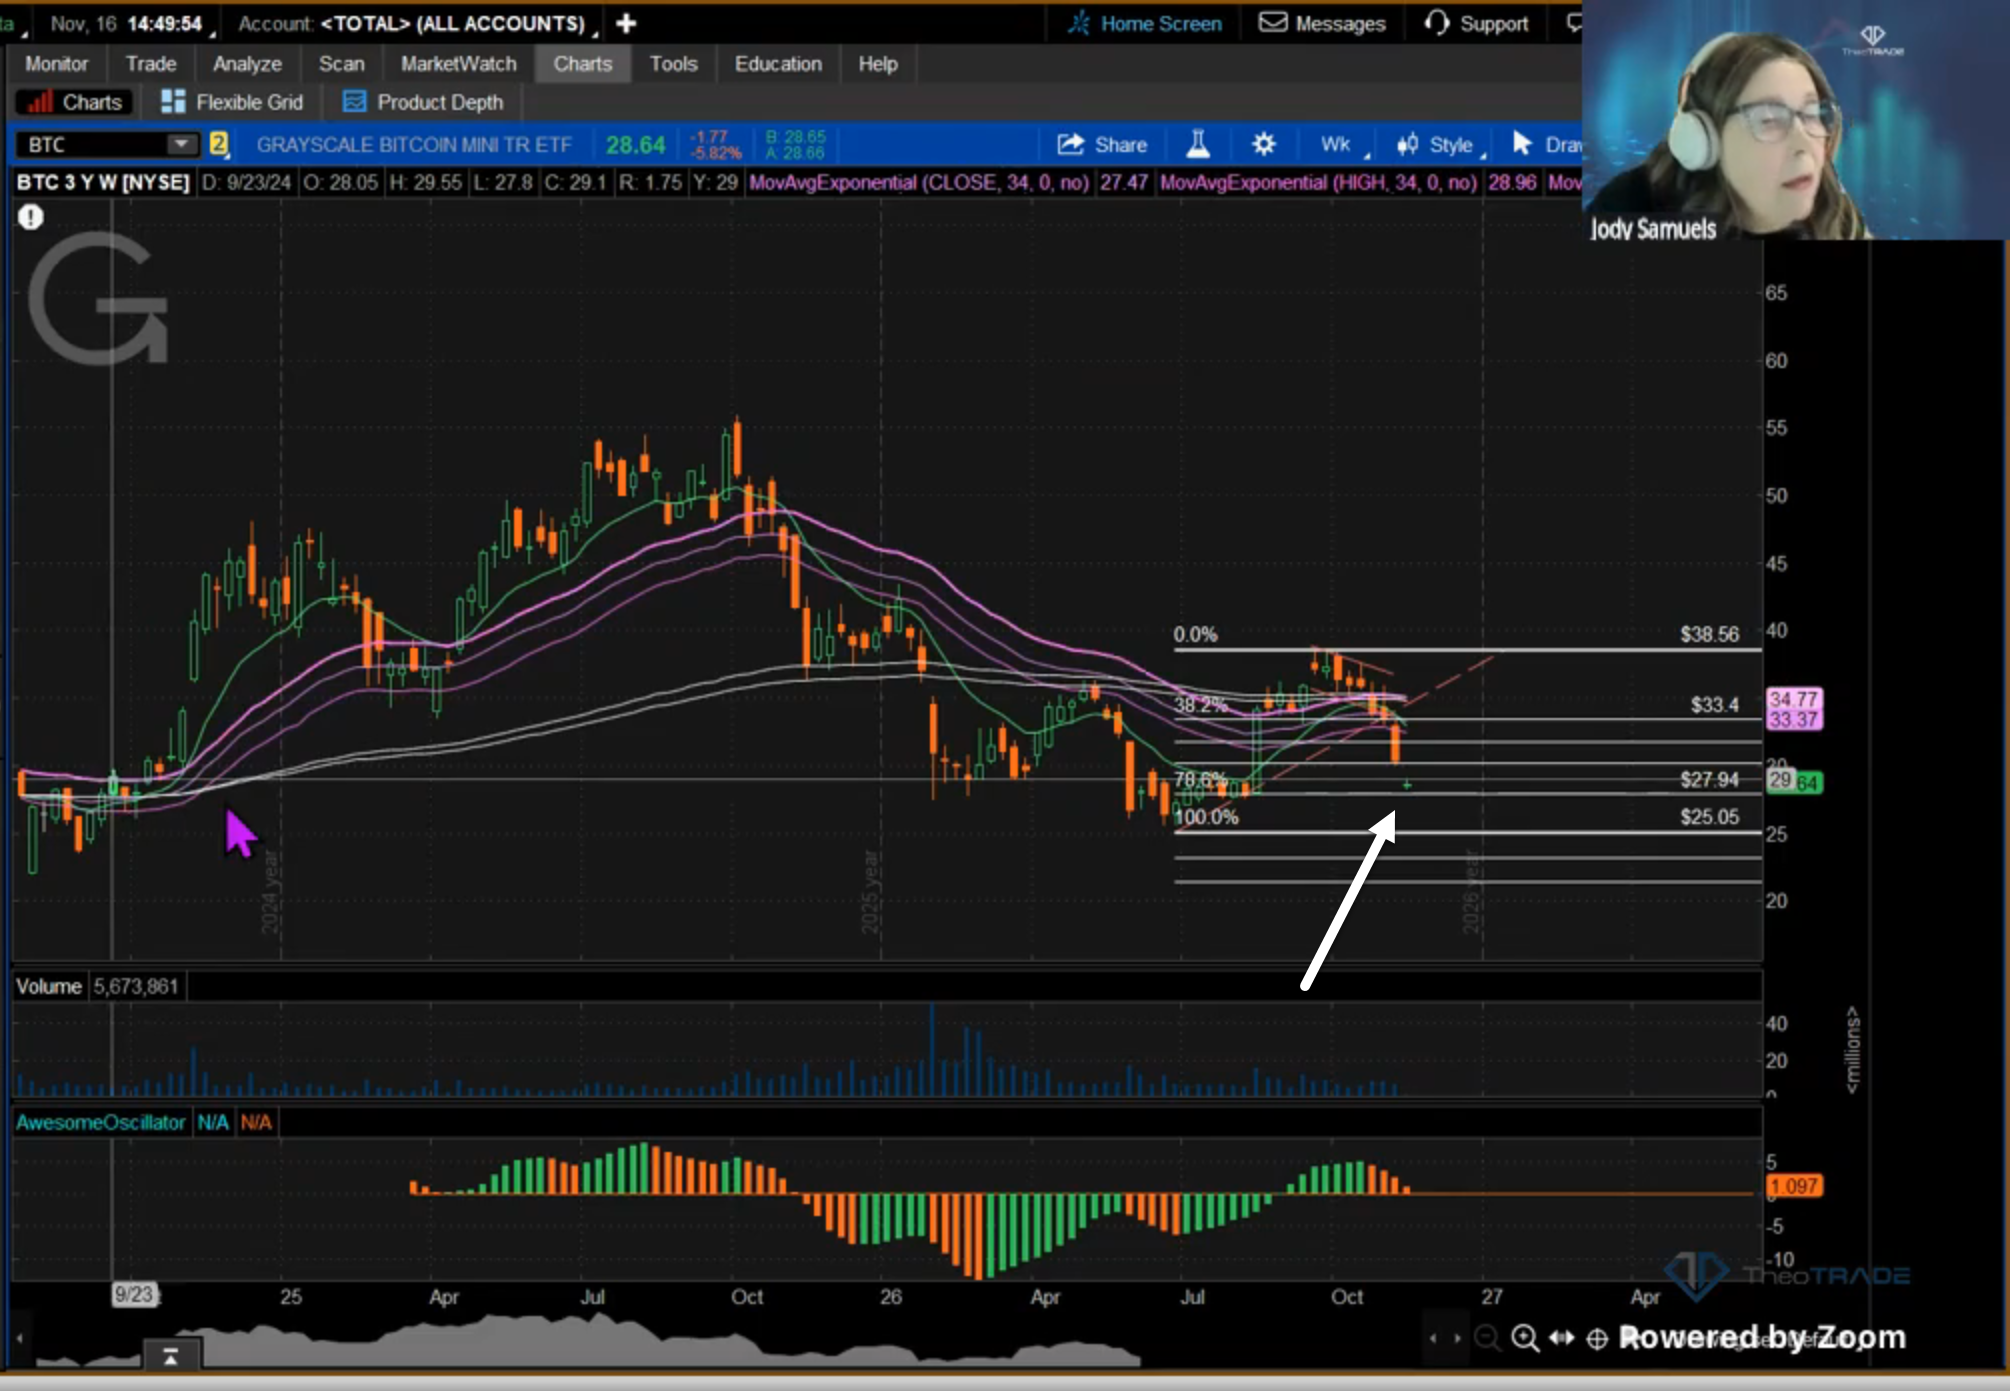
I find that a break below 78.6% puts the 100% level right around the corner. The 100% level is the prior low.
Bitcoin needs to hold 78.6%. Otherwise, it might make a new low.
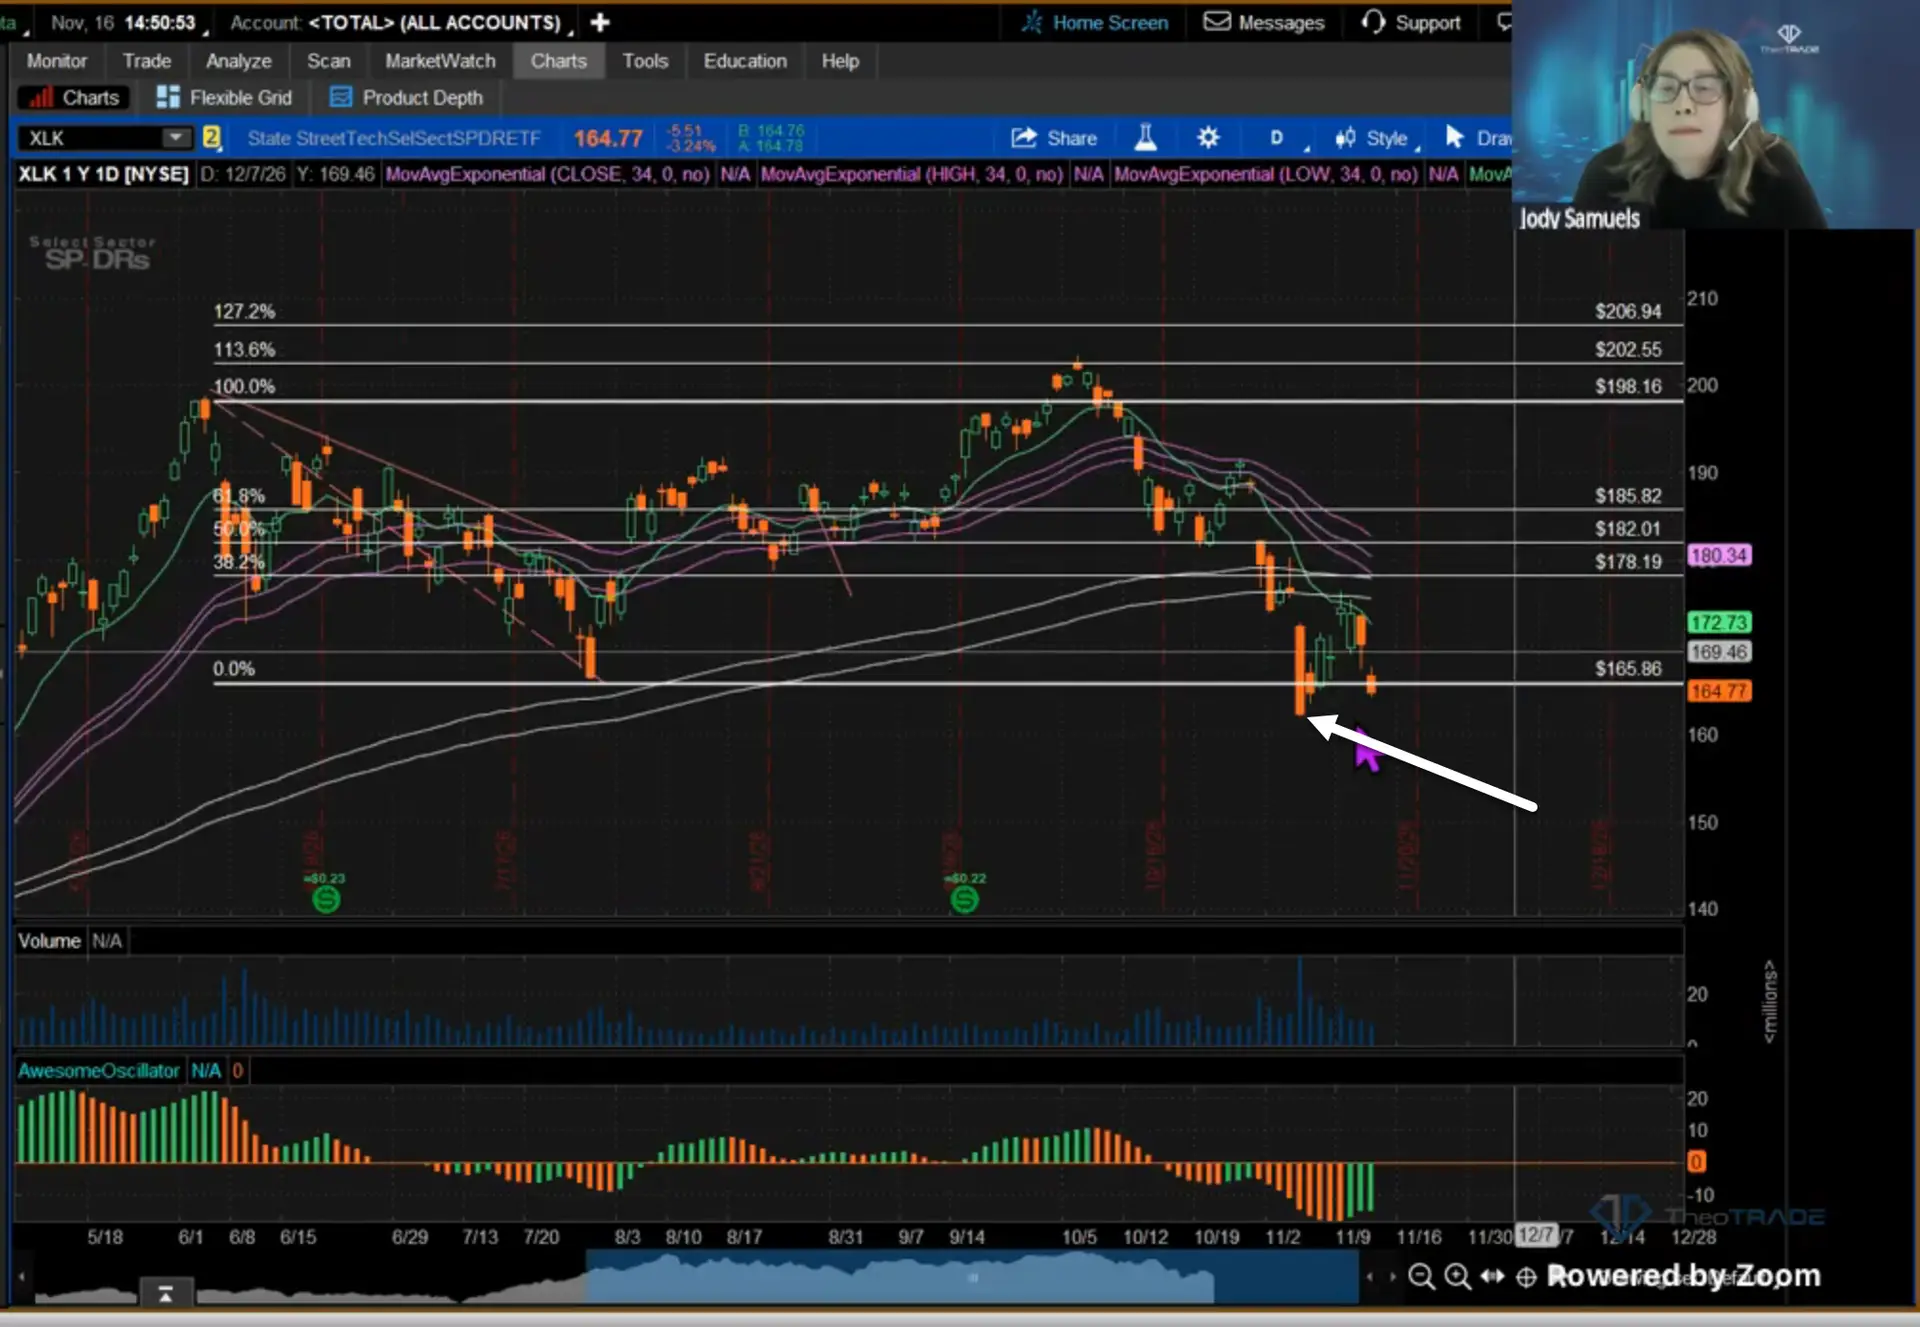
The tech sector ETF, XLK, looks similar against its own Fibonacci retracement levels on the weekly chart.
It’s probably sitting near a 78.6% pullback. It has to hold its low to avoid testing lower.
How to Use the Depth Limit This Week
You can run this check with Fibonacci retracement levels on any chart you trade. Here’s the order I follow:
- Draw Fibonacci retracement levels from the low of the last move up to its high.
- Mark 61.8%, 78.6% and the prior low before price arrives.
- Watch the candles at each level. Wait for price to take out a reversal candle’s high.
- Decide ahead of time what you’ll do if the prior low breaks.
This week will put those levels to work. NVIDIA reports after today’s close.
Today also brings retail sales. The Fed minutes come out Wednesday, and Anthropic’s IPO starts trading Thursday.
I expect a choppy week with high volatility. I don’t like taking positions into earnings, because they’re too volatile and too risky.
Fibonacci retracement levels give you a plan before the headlines hit. You’ll know where the trend survives.
You’ll also know where to step aside.
Running these checks on every chart you follow takes real time, though. Dunk Alerts does that watching for you.
My tech team and I built a scanner that covers 4,782 markets. I run every candidate it flags through my three checks myself.
When a trade passes, you get the alert with my entry, my target and the plan. Every alert comes with a stock play and an options play.
The Black Friday launch price runs through Wednesday, December 9, at 2 PM ET.
Get my next qualified trade at the Black Friday launch price
Jody Samuels
Queen of Quid