Hey Trader,
The S&P 500 broke out today. I want you to ignore it.
Because there is something far more important that tells you the strength of the market.
You see, the index is one number. It hides what’s happening underneath it, and you pay for that blind spot when the leaders finally quit.
Right now, twenty stocks are carrying this market. The other 480 are garbage that nobody even tracks.
In fact, half the S&P 500 index sits in bear market territory!
Let me give you an example.
Merck printed a 52-week high this morning. J&J sat right on an all-time high.
McDonald’s printed a multi-decade low on the same tape. Nothing is wrong with the company.
I have watched that setup resolve once before.
That time, we corrected from 6,800 down to 5,400.
And while I love the advance-decline line, it only gives you a snapshot of things.
The better version: the CUMULATIVE advance-decline line.
This modified version can tell you so much more about the market.
And I’m going to show you exactly how to use it.
What The Advance Decline Line Actually Counts
The advance-decline line does one job every session: It subtracts the number of decliners from the number of advancers on the New York Stock Exchange.
About 3,000 names trade there.
When the line zigs down, more of them fell that day than rose.
There is also a cumulative version that adds the number up day after day. You get one running total of participation instead of one price.
I pull it up on the Thinkorswim platform under the advance-decline cumulative average. I set the weighting to 3 so both lines read cleanly.
That study is not a price indicator.
It measures how many stocks are participating in the move you’re watching.
The S&P 500 is an index. It’s a market of stocks rather than a stock market.
What The Breakdown Looks Like On A Chart
Pull up the E-mini and go back to where this bull market started. The S&P 500 ran from 6,529 last year to where it sits today.
Now forget everything in the middle of that screen. The read you need sits along the bottom of the chart.
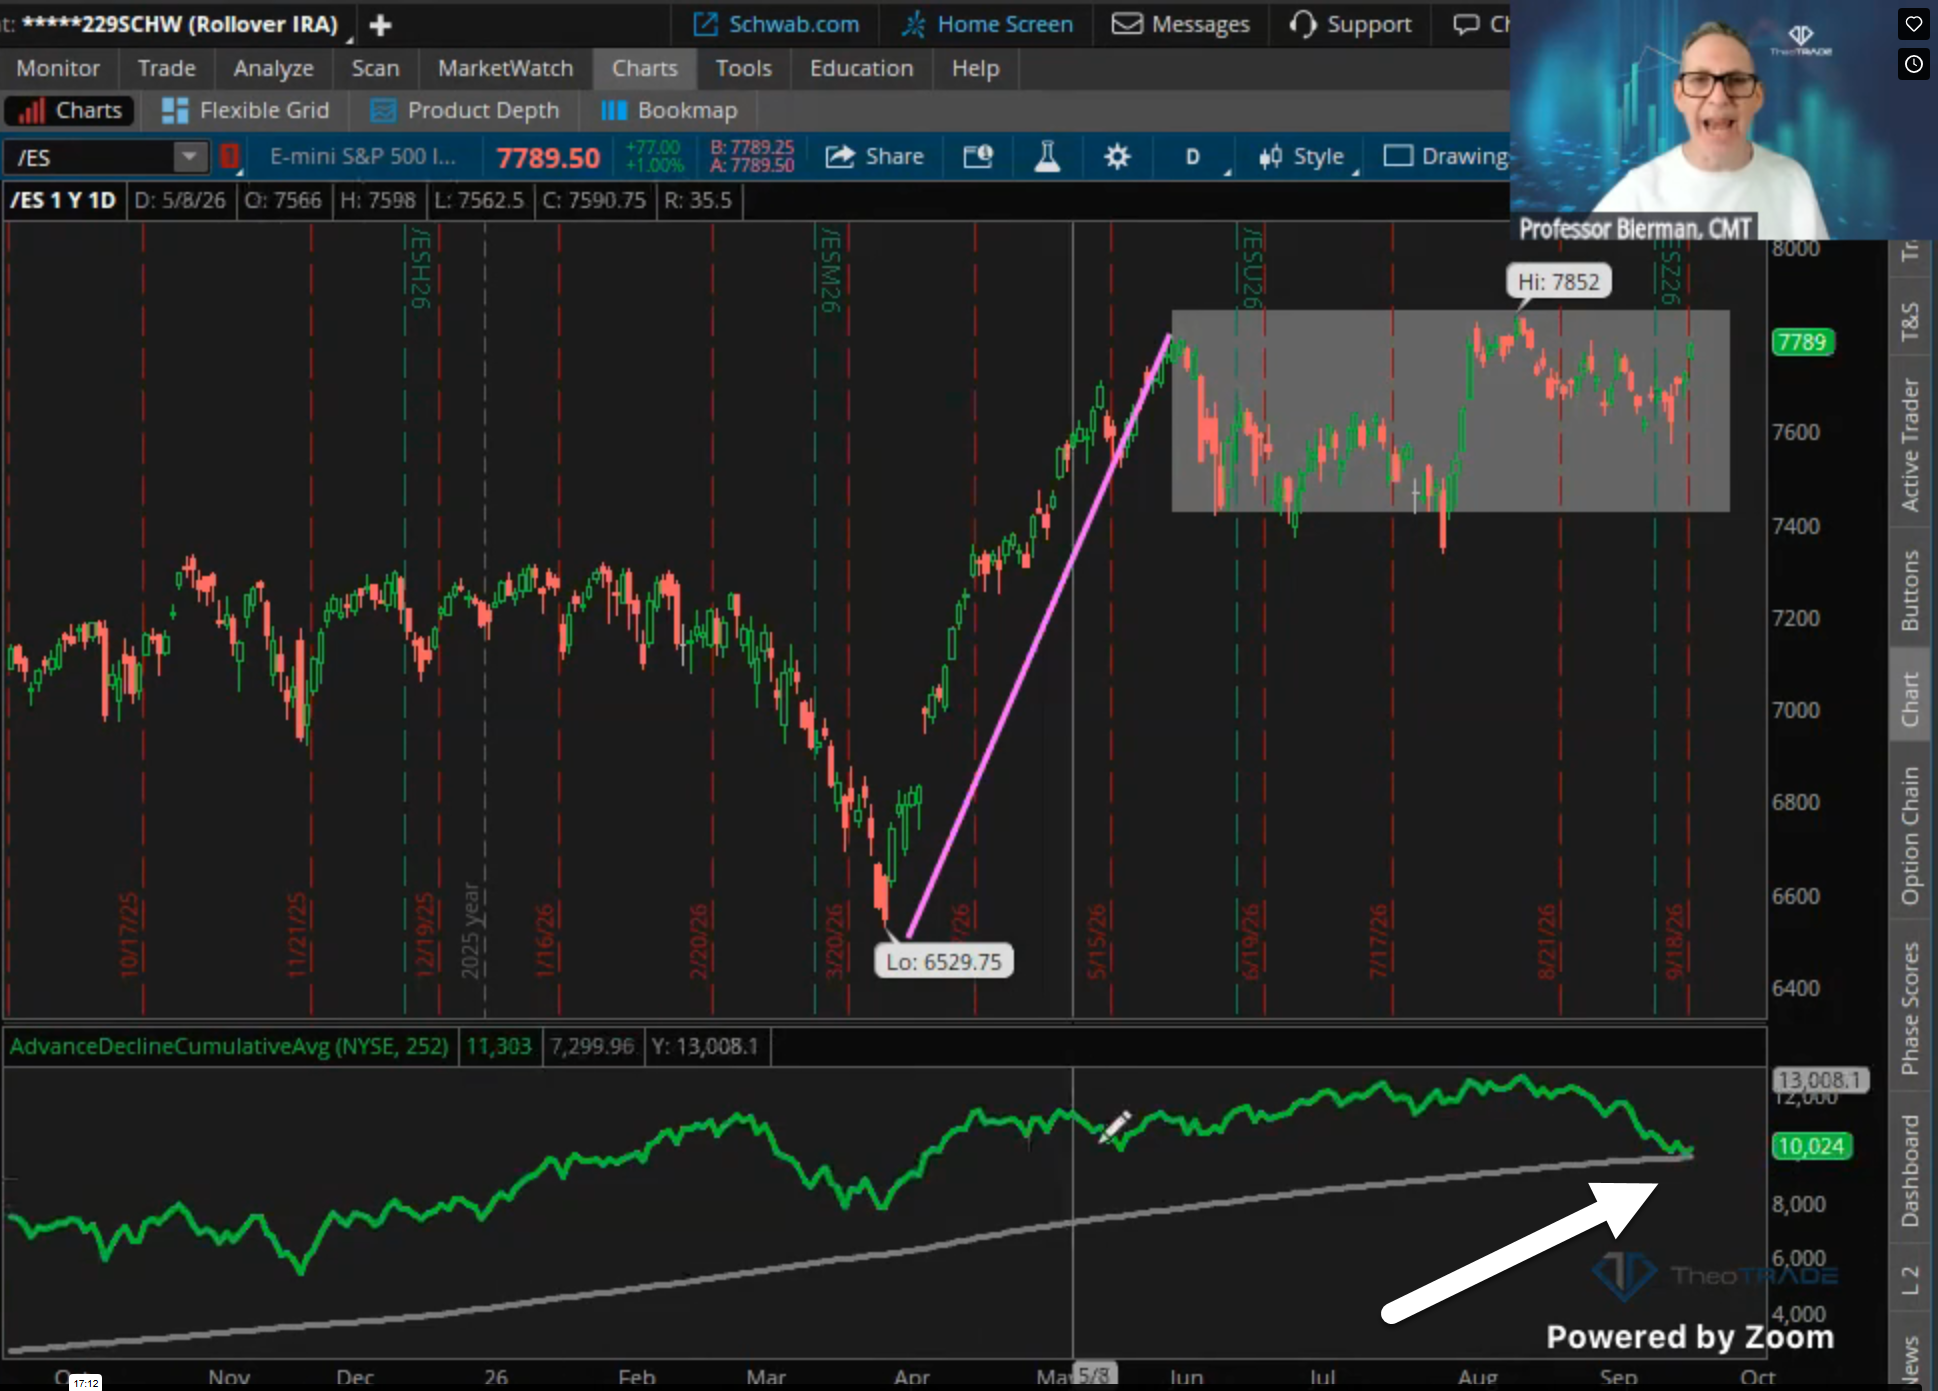
That jiggly line at the bottom is pressed right against the 252-day moving average. It has been fighting that level and losing ground for a while.
Price broke out today. That breadth line never followed it.
When a cumulative breadth line breaks through there, it opens trap doors beneath the market. The price chart gives you no warning at all.
The Last Time This Line Broke
I have watched this exact setup resolve before. The line pressed the same moving average, gave way, and the market went with it.
We corrected from 6,800 down to 5,400 on that break. Nobody got a warning off the index.
We’re up against it again right now. They’re defending it with everything they have.
If it goes through, we get some type of correction first. Above and beyond that, we go into a bear market.
A breadth line that can’t hold its own moving average has already told you who won.
Twenty Stocks Are Holding Up Five Hundred
Look at what carried the tape today. Merck printed a 52-week high and J&J sat right on an all-time high.
Meta ripped higher. NVIDIA did the same thing.
The same mega caps carry this market every single session.
The other 480 names didn’t matter today. Money managers sold everything that looked ugly and bought the pretty charts.
McDonald’s printed a multi-decade low into that rally. Nothing is wrong with the company.
Its comps are incredible. The market just sells what’s down and buys what’s up.
Half the S&P 500 sectors sit in bear markets already. Consumer staples, retail, utilities and REITs are all in one.
If any one of the Mag 7 to 10 gives out, we get destroyed. Nothing sits underneath this market to catch it.
How You Run This Tomorrow
Start with the breadth line before you look at a single price. Three checks tell you whether the index deserves your trust.
- Whether the cumulative advance-decline line is holding above its 252-day moving average
- Whether the same 20 mega caps are leading the tape session after session
- Whether the sectors you own are participating or printing 52-week lows
The first check does the most work. A market making highs on deteriorating breadth is running on a handful of names.
Then stop trying to short the index off that read. If you worked for me and shorted this market today, I’d fire you.
Never short a market that breaks out. Never short one with thin liquidity.
I’m short individual stocks right now and cleaning up. I got short another one today and it’s already breaking down.
Breadth tells you which way this market resolves. Individual names are where you collect on it.
Right now, breadth tells me this market is fragile. It doesn’t hand me the ticker that pays for it.
That work happens every week in my scan across 200+ names. I check the Smoke Pattern, the Heat Gauge, the Fuel Line and the Draft on every one of them.
When 2 or more of those line up on the same stock, I send the alert before the move becomes obvious. Breadth gives you the warning. The BURN SIGNAL gives you the trade.
The Burn Room hasn’t lost a closing trade since early July, and the next alert goes to people already inside.
👉 Get The Next BURN SIGNAL Alert
Professor Jeffrey Bierman
Creator of the Genesis COG System