Today the market is down again slightly, while the VIX is up again. This selloff isn’t enough to change the paradigm that the market is overvalued. It feels worse than it is because of the endless rally we’ve seen. It has been 149 days since the last time the S&P 500 corrected 5%. The longest streak without a 5% correction in this bull market was 158 days. We’re approaching being in the least volatile period of what has been the second longest bull market in history. It’s shocking to see such a calm period in such a turbulent political environment.
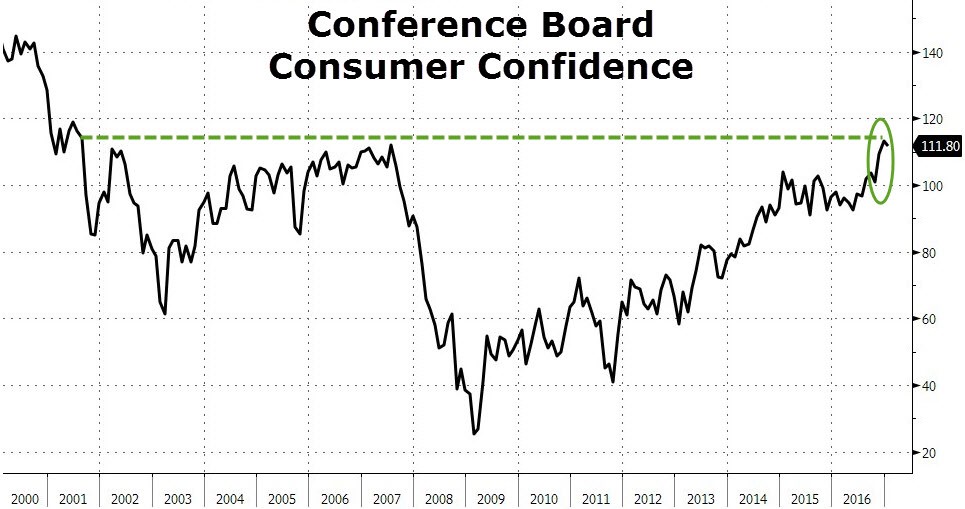
Today the Conference Board Consumer Index was released. I have been using it as an indicator which needs to be faded. My response to the consumer sentiment depends on the point in the cycle. At the end of a recession, the lower sentiment gets, the better the buying opportunity. At the end of a bull market, the higher it gets, the more bearish I get. In the last article, 110 was used as a measuring stick for when it becomes a reversal indicator. However, when the bull market is young, increased sentiment is a positive because it shows the recovery is intact.
Across the board, the survey showed consumers seeing current conditions improving, while lowering their expectations for the future. The overall index fell from 113.3 in December to 111.8 in January. The Present Situation Index went up from 123.5 to 129.7, while the Expectations Index fell from 106.4 to 99.8. The excitement in November and December appears to have been a self-fulfilling prophecy which helped the economy. There was a decent amount hiring and inventory being built in anticipation of the economic growth in 2017 brought by Trump. Enthusiasm isn’t a building block for long term growth. The only thing which can sustain this growth is if demand matches or exceeds the production. That’s when the pedal hits the metal.
There may be some regret by businesses that they hired all those people and produced all that inventory which may be why future expectations are dropping so fast. Consumers’ net expectations for business conditions (improve minus worsen) declined 3.4 points. Consumers’ net expectations for the labor market (more jobs minus fewer jobs) fell 1.9 points. Finally, net expectations for incomes (increase minus decrease) fell 4.5 points.
The other possibility is the hype surrounding the election has faded and people are recognizing no magic wand will be waved to create accelerated growth. It doesn’t mean we’ll see an impending crash in the index. It was at an unattainably high level. The best-case scenario would be if optimism falls, while demand grows.
There are a lot of reasons for the consumer to be negative. One of them is home affordability is low. Housing prices have risen and lately interest rates have also been rising which is a terrible combination for home affordability. The chart below shows the price of median houses and the home ownership rate. The increase in home ownership in the 1990s and early 2000s was a result of government guaranteed mortgages which distorted the housing market. The government should not be promoting home ownership because these good intentions lead to bad consequences. Namely, those who can’t afford houses, buy them and then default on the loans.
Because home ownership has fallen to below what it was at before the real estate bubble, less consumers have participated in the rally which has now exceeded the heights seen in the last cycle. The wealth effect of having house prices increase in value tends to boost spending. 5.5% less consumers are experiencing this wealth effect than in 2005. Another aspect to keep in mind is demographics. Millennials have a different viewpoint on owning a house. This may be spurred by their lower incomes and lack of family development. However, there’s also a philosophical difference. As a millennial, I see buying a big house as a waste of space. If I was a millionaire, I still wouldn’t buy a big house. Owning a house isn’t the status symbol it once was.

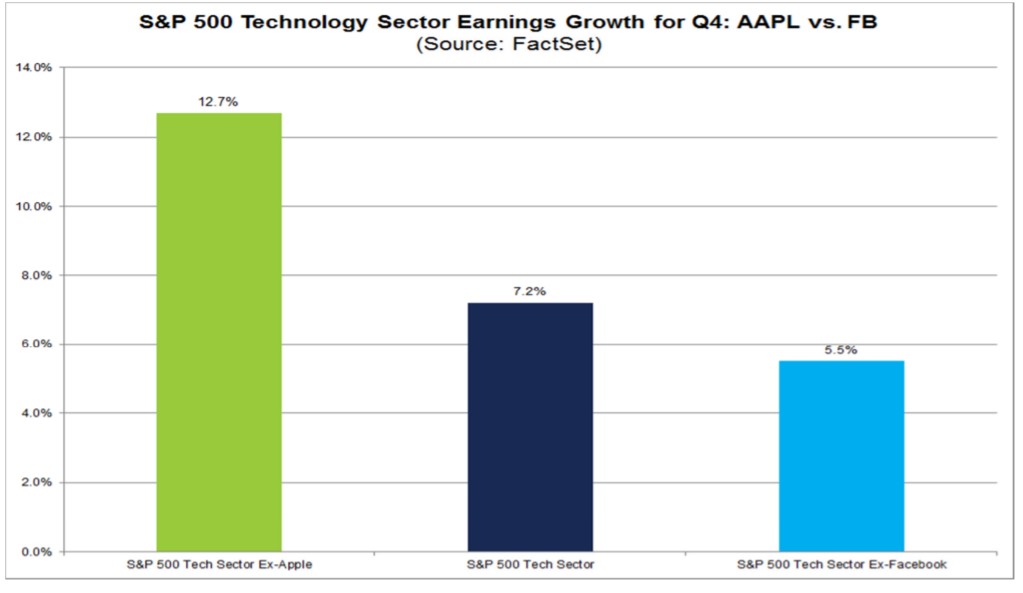
Tonight, we will hear from Apple on how its earnings for the holiday quarter went. Apple is both a signal for the health of the consumer and an important part of the S&P 500’s earnings. Apple is highly profitable and has a large market cap which means its effect on the indices it is in (the Dow, S&P 500, and Nasdaq) is large. The chart below shows the S&P 500 tech sector’s earnings growth without Apple. As you can see, Apple weighs down the tech sector’s earnings growth by 5.5%. It also shows how Facebook boosts earnings growth by 1.7% which makes it the largest driver of earnings growth. Its effect is about a quarter of Apple’s effect on the S&P tech sector.
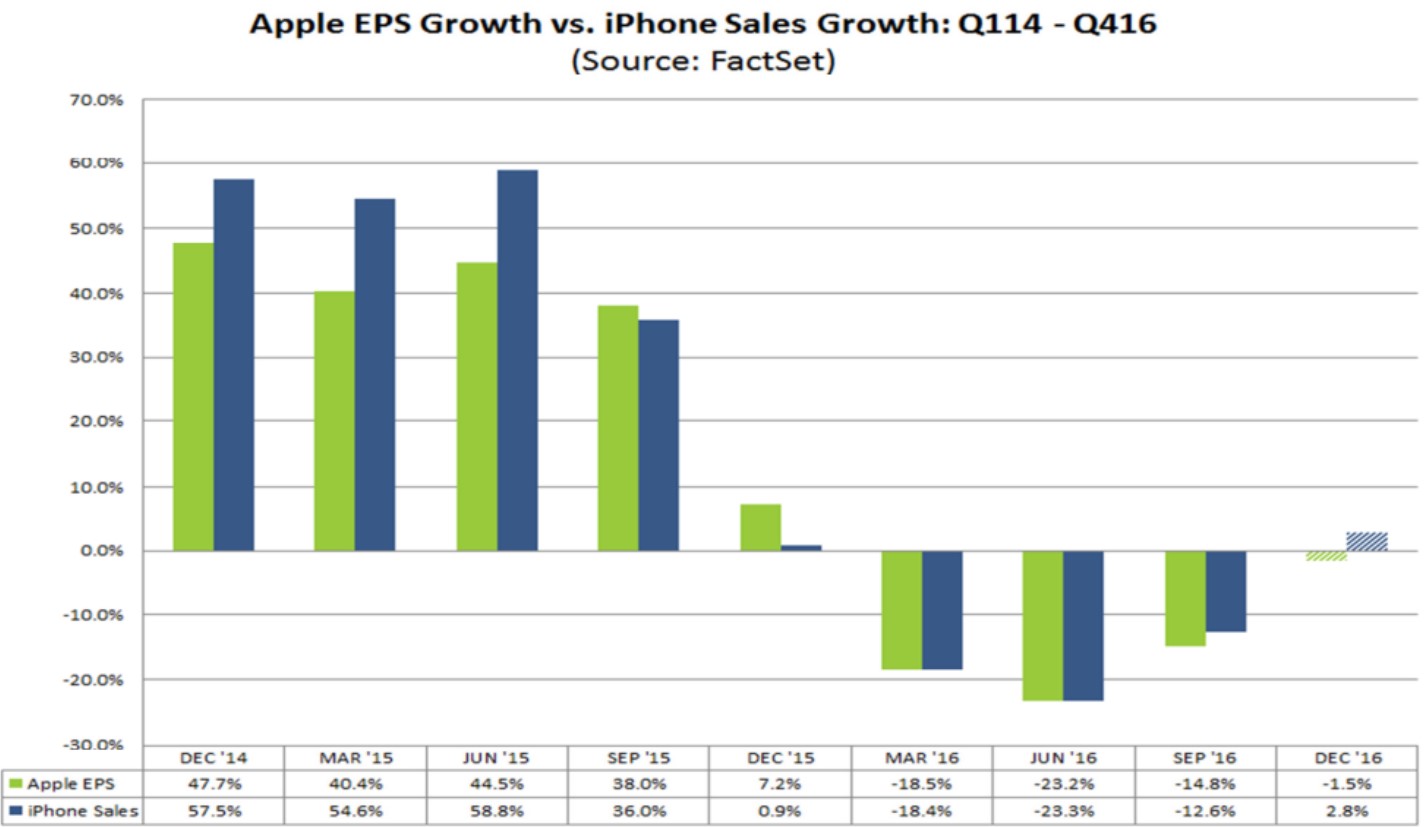
Apple’s earnings decline in 2016 was a big driver of the earnings recession. The S&P 500 is now exiting that recession as Apple is projected to see only a 1.5% decline in year over year earnings in Q4. If it beats that estimate, growth for the first time since Q4 2015 is possible. It begs the question if the market drives Apple or if Apple drives the direction of the market. iPhone sales are finally expected to grow again. It is the single most important product to the S&P 500’s earnings growth. Even if you don’t have a long or short position in Apple, it’s worth paying close attention to the earnings call. It will determine where the market heads tomorrow.
Conclusion
Consumer sentiment is falling after reaching peak euphoria in December because expectations have deteriorated. If the market continues its selloff, the February report will be even worse. Apple’s earnings report will have a major impact on the direction of the market. It’s also worth keeping in mind, that the consumer shouldn’t be this positive given the historically low household ownership rate which is driven by millennials not forming households as quickly as prior generations.
Recent Comments