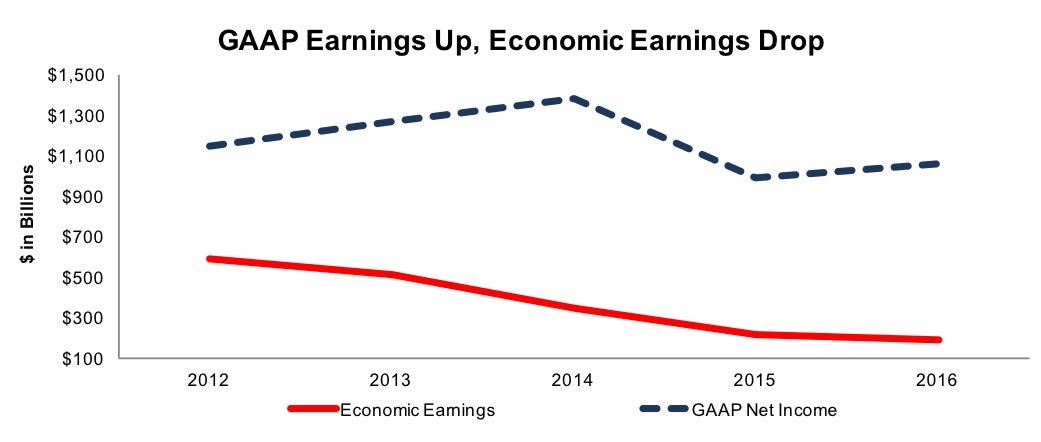
The last article was about corporate earnings. There are many ways to measure earnings. The top measurements are GAAP results and operating earnings. As I have shown in past articles, the BEA’s measurement of corporate profits shows lower growth than bottom up GAAP analysis. The BEA’s estimate is a top down analysis which looks at profits from current production of all firms and adjusts for inventory valuation and capital consumption. Another similar measure of corporate profits is seen in the chart below which compares economic profit growth to GAAP profit growth. Economic profits have been declining since 2012 while GAAP earnings have been rising besides the earnings recession in 2015. Economic earnings are another method of measuring profits which many argue is more complete. GAAP was originally used for debt investors. Economic earnings better represent cash flows, are standard for all companies, and are based on the financial information available.
There are a couple takeaways from this information. Firstly, the BEA’s measurement of corporate profits are of all corporations, not just the S&P 500. Because small businesses are seeing declining margins, growth is much slower than the firms in the S&P 500. I think optimism about the top firms is helping small firms have positive stock performance during this difficult period for them. However, the crowding of investors’ capital into the top firms helps them continue to out-compete small firms. Another takeaway is that the past few years of earnings growth may not be as great as the accounting earnings using GAAP suggest.
Profits have recently been growing faster than the economy. Even the BEA’s low earnings growth in Q1 was quicker than year over year GDP growth. Year over year GDP growth was 2.04% in Q1 and was below 2% growth in the 3 prior quarters. The BEA’s measurement of corporate profits shows growth of 3.7% in the past 4 quarters. Corporate profits are impacted by interest rates, the money supply, and the tax rates paid. Earnings are also effected by GDP growth which is why we look at the macroeconomic data. As you can see from the chart below, the Z-score of the soft data has been falling as the surveys have been missing expectations. The hard data shown in the white line has been seeing disappointments of late as well.

The chart below shows the updated Citi Surprise index. It reflects the data seen in the chart above. If you’re comparing the latest draw down in the index to the one in early 2015, the z-score for the soft data started from a higher place this time around. If the z-score for the soft data simply falls back to 0, the Citi Surprise Index can easily challenge the lows seen in early 2015. 2015 was a year of volatility in the stock market, but the correction occurred in August which was after the surprise index rebounded. It’s possible the market had pent up selling pressure which led to a delayed reaction. Certainly, it’s not an advantageous position to have most soft and hard economic reports missing expectations.

One of the reasons why economic surprises may be negative is because the credit cycle may be turning. C&I lending has peaked. As you can see from the chart below, quarterly EBITDA growth for U.S. leveraged loan issuers has gone negative for the first time since 2009. If lending is no longer profitable, there will be less of it. Lending to risky businesses is the first credit action which is curtailed when the cycle is ending. Eventually it becomes difficult for investment grade borrowers to get a loan just like it was difficult for well qualified buyers to get a home mortgage in 2010.

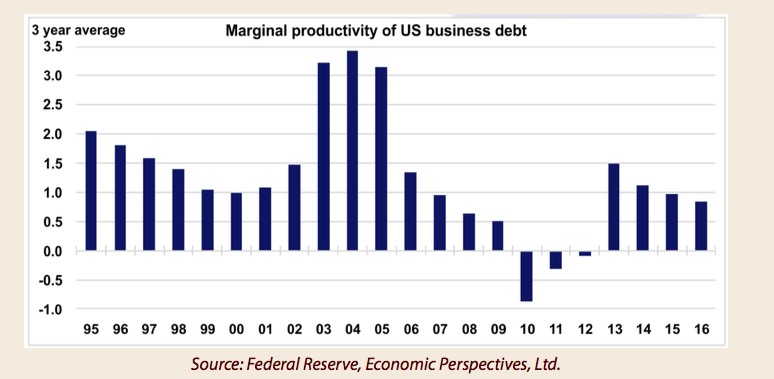
It’s not surprising to see lending standards increasing and leveraged loan issuers seeing negative profit growth because as you can see in the chart below, the three-year average marginal productivity of business debt has declined since 2013. The 2016 three-year average marginal productivity of business debt is below any point during the early 2000s recession. This averaging effect is why the productivity declines after the recession in 2008. This effect makes it less susceptible to near term noise in the data. The 2016 three-year average marginal productivity of business debt is below what it was in 2007 which is clearly a bad sign. At the end of the cycle, when interest rates on junk debt is low, those firms don’t allocate the capital effectively. At the beginning of the cycle, the investment grade firms that couldn’t get capital during the recession, get money. This boosts productivity of business debt as the pent up demand is fulfilled by the best companies as the weak companies wouldn’t even try to get a loan with such high rates and tight standards.
At the end of the cycle even investment grade firms are highly leveraged. As you can see from the chart below, the investment grade gross leverage has been above 2.7 for three quarters. This is the equivalent to a credit rating of BBB. This chart includes energy. The improving profit growth of energy firms in Q1 did little to push down leverage. Keep in mind, most of the investment grade leverage doesn’t include frackers who are junk rated. Even the major integrated oil firms are highly leveraged and remain so after the rebound in oil prices. Giving additional debt to firms who are already highly indebted doesn’t add much to productivity. Because they are highly leveraged, they qualify for less loans. These factors are pushing up lending standards and pushing down the productivity of marginal debt.

As you can see from the chart below, corporations are simply taking the money they borrow and piling it into stock buybacks and dividends. This is not a sustainable. It’s almost like a Ponzi Scheme as corporations are taking in almost free money to enrich the shareholders instead of investing in growing the business. Once the cycle is over, the reverse will happen as less money will be borrowed and dividends and buybacks will be cut.

Recent Comments