
Hey trader,
The S&P 500 dropped about 1.6% on Friday, and the financial media is still hunting for the headline that did it.
It would be easy to pin the move on one news story. The selloff was already on the clock before any headline crossed.
The warning was sitting in the volatility curve a day earlier. The three-month to one-month VIX ratio had pushed up to 1.25, the most stress the vol market had priced since late December.
That is the read I run every session. It flashed bearish well ahead of the candle.
Stick with me and you will see what the curve was saying, why the drop finally arrived, and where the next test sits.
What The Curve Was Telling Us
The three-month to one-month VIX ratio is the forward premium on volatility. It compares the stress priced 90 days out against the stress priced over the next 30.
When that ratio climbs, the vol market is bracing for trouble. When it sits low, the market is relaxed.
Yesterday it hit 1.25. That marked the highest volatility expectations since the end of December.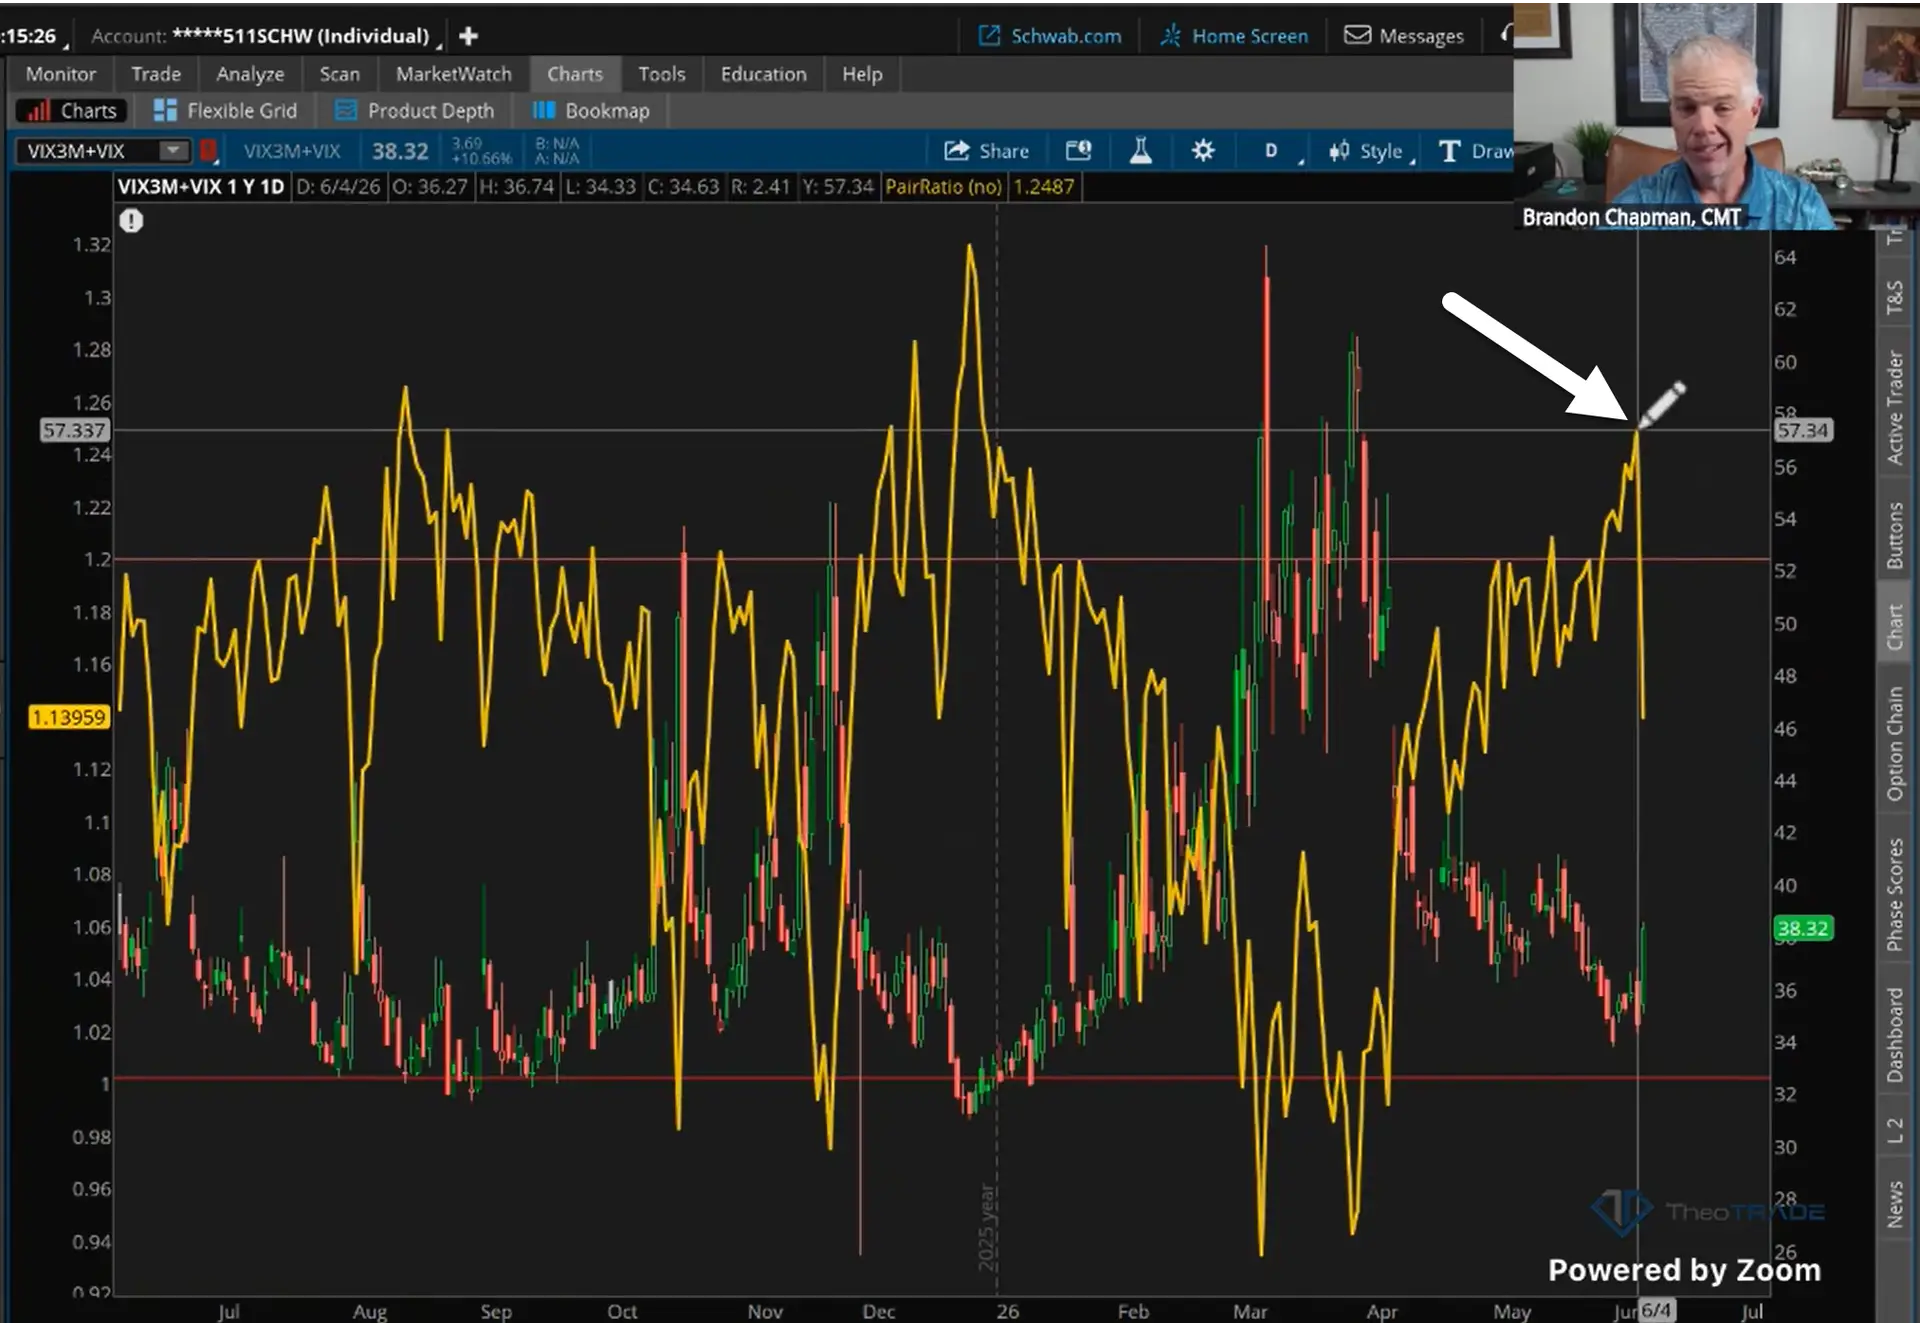
A reading that high carries one message. It says hedge, and take profits. That is the bearish side of the gauge.
A Warning That Ran For A Month
This was not a one-day signal. The vol market had been pricing a 5% to 10% correction since the beginning of May.
That is roughly 30 days of the curve leaning bearish. Friday is the session where it finally started to pay out.
Now the ratio is coming back in. The VIX is finally moving. That compresses the forward premium as near-term fear catches up to the longer-dated stress.
Why The Index Looked Calm Anyway
Here is the part that fooled people. The VIX itself sat at 15 to 16 even while the curve was bracing.
Skew told the real story. It sat at 142, which reads high bordering extreme against a 30-year history.
Anything north of 130 is high. A 142 handle means institutions were heavily hedged, buying puts and selling calls.
The headline VIX stayed low because of the dispersion trade. Desks were selling index options and buying calls on the Mag 7 names.
That held the index number artificially down. Single-stock volatility ran hot the entire time.
How The Warning Became A Drop
The vol curve sets the backdrop. The gamma structure delivers the actual move.
The upside call wall slid from 760 down to 750 this week. Below 755, the market dropped into a negative gamma regime that runs all the way down.
For Friday’s expiration there were about 73,000 puts stacked against 16,000 calls into 740. There was almost no call structure to cushion a fall.
As those puts pushed into the money, their delta climbed toward one. The dealers short those puts had to sell stock to stay neutral. That selling fed the decline.
The Level That Cracks It Open
740 is the line that matters now. It carries a pinning effect from that 73,000-contract wall, so price gets pulled toward it and then stalls.
A break below 740 is where it changes. The delta on those puts jumps from the single digits toward one. The dealer selling accelerates from there.
That is the move that would crack the VIX wide open. Up to that point the index can stay deceptively contained.
What To Carry Into Next Week
The structure shifted lower for next week as well. 750 is the new wall that 760 was. 745 is the key level building negative gamma beneath it.
None of this is a forecast. It is a map of where the pressure sits and where it releases.
The curve flagged the setup a day before the candle confirmed it. That is the edge, reading the volatility structure while the tape still looks calm.
Brandon Chapman, CMT
Creator of Ghost Prints