Hey trader,
Yesterday the SPY 500 spent the whole morning stuck.
Price kept circling one number and refused to leave – 745 – and it acted like a magnet.
The easy move was to scalp the little wiggles around it.
I passed on every one of them.
Instead, I waited for a single clean setup.
The plan I laid out returned 67% on a sub-60-cent trade.
I want to show you how the map told me it was coming.
You see, there was a reason 745 held price like glue. However, the clean trade lived somewhere else entirely.
I’m going to walk you through building that plan from scratch, the same way I built today’s.
The Map Comes Before the Trade
Before I take a single trade, I map the gamma structure.
Gamma exposure, or GEX, essentially tells me where dealers are forced to stabilize price and where they let it run.
Positive gamma stalls the price. Negative gamma expands it.
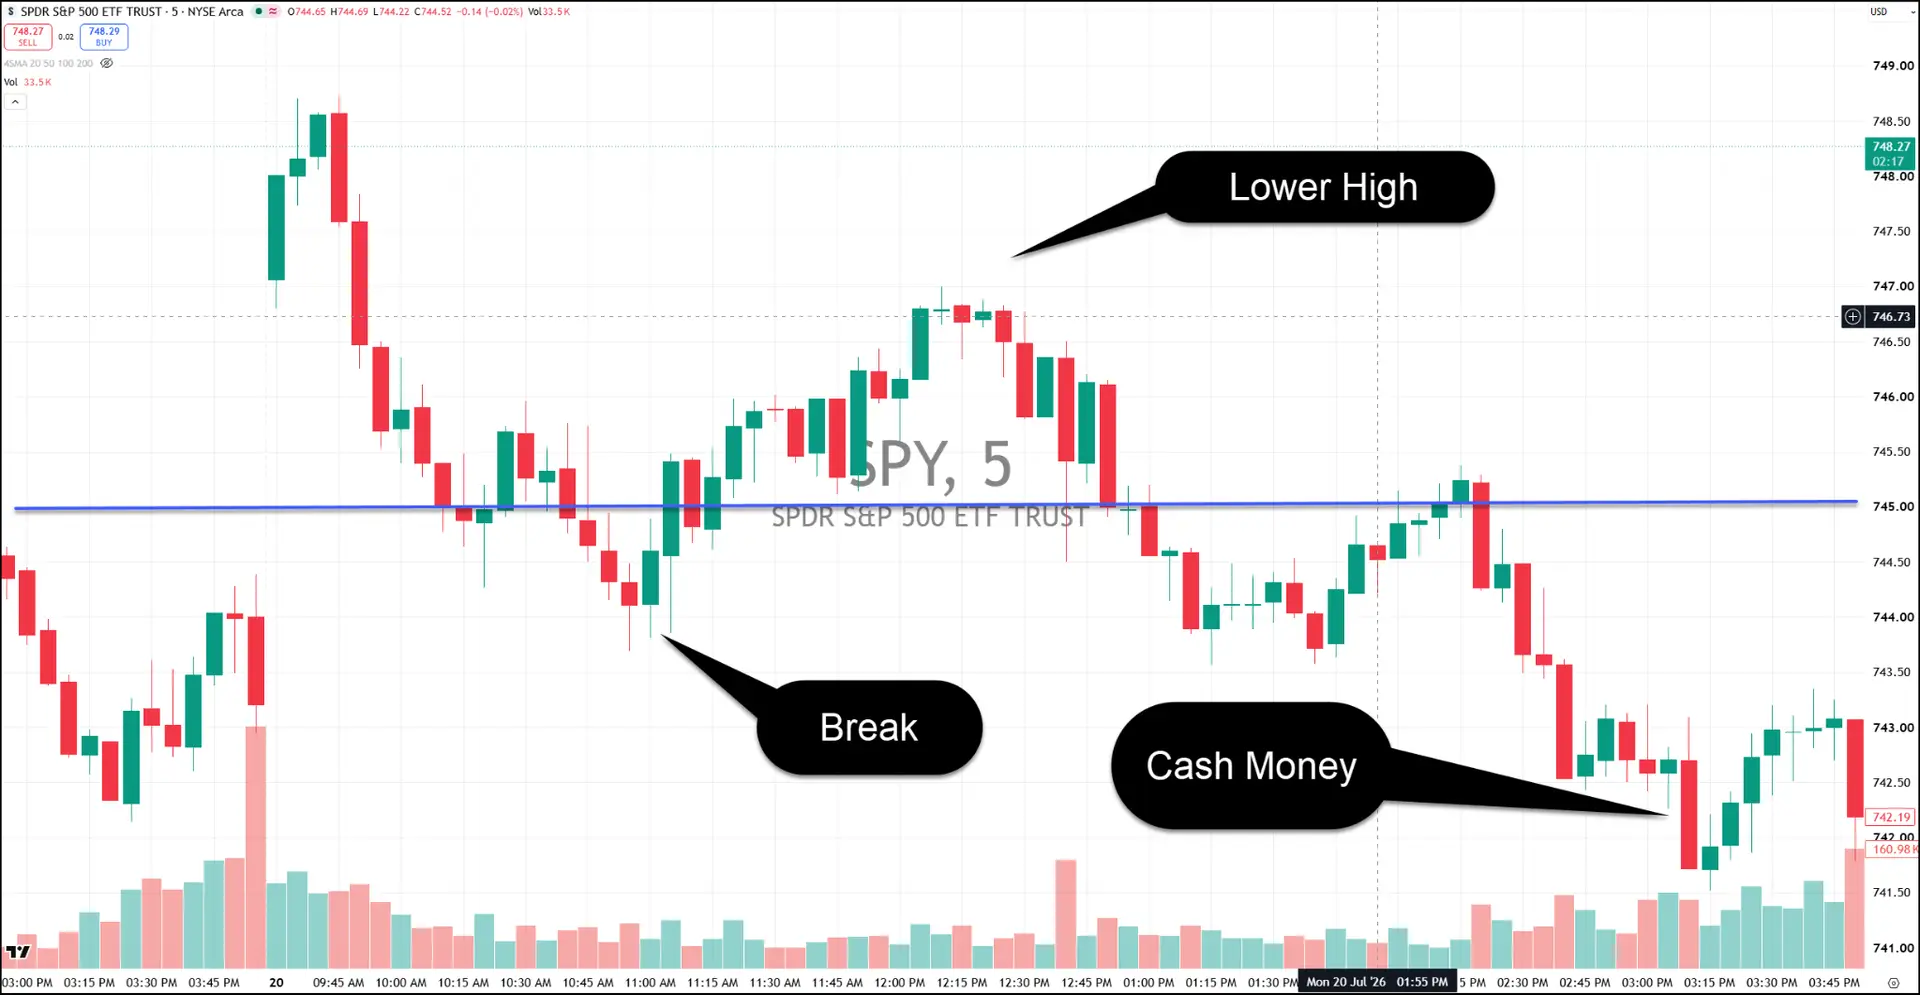
Yesterday the whole map turned on one level. 745 was the magnet, and price kept getting pulled back to it.
I did not see clean positive-gamma structure until north of 750. We never got there.
That left the small moves in the middle. Price ran 749 to 745, then 747 to 743.50. Those were decent moves on their own. The structure around them was still messy.
There was not enough meat on the bones to trade. I did what I always do here. I waited for one good setup.
Here was the plan:
- Wait for a break of 745
- Then wait for a lower high.
- Use the negative gamma to ride the market lower
Once price broke and rolled over, the entry came on the close below the high candle.
Below 745, we were in a negative gamma regime, which basically means dealers sell into weakness.
Price failed at 745 twice. Each rejection set up another bearish entry. It ran as low as 741.50.
The trade was a 743/741 put vertical. That just means I buy one strike and sell another to cap the cost.
It filled for under 60 cents. It could be sold for a dollar.
That is 67% on the table, and I laid it out the day before. It played exactly as mapped.
I missed the fill myself. I had a session starting at 11:45, went to update my slides, and forgot to send the order. The plan still worked.
Building Today’s Plan From the Same Map
Today started on the same map.
The SPY sits in positive gamma, and that structure firmed up as the day wore on.
Volume picks up again at 745 or below. That is the same setup I traded yesterday.
Above price, 750 is the call wall. That is a heavy cluster of call contracts that tends to cap a move.
About 15,000 of them are stacked there for today’s expiration. Only two sit on the put side.
That gives me two ways to play it.
The first is the bounce. I can get long on a close above the recent highs and stay long toward 750, then close into the wall.
The setup I actually prefer is the break. I want to see price fail below 745 with a lower high, the same trade as yesterday.
Here is the fade I am watching if we run hard into that wall first:
- Setup: The SPY in positive gamma, with 750 acting as the call wall into today’s close.
- Trigger: A directional run into 750 that puts in a lower high or an equal high.
- Structure: Buy the 749, sell the 747, trying to get in for less than 60 cents.
- Target: Close around 748, where price tends to pin late in the session.
- Edge: The wall stalls the run, and the 747 and 748 strikes pull price into a magnet once it backs off.
Break 747 after that, and we head back toward 745. The map hands me the next level before I ever need it.
Start With Structure, Not the Chart
The plan never starts with a chart. It starts with the structure.
I want the wind at my back before I enter. That means I am not buying straight into a call wall and hoping it breaks.
I want to see a negative gamma environment forming, or price already working with a level instead of against it. Then I take one clean setup and let the map do the rest.
Now, this is just the tip of the iceberg. Because once you learn to read options activity, a whole new world of trading opens for you.
Every day, members and I use my proprietary Block Hunter Console to identify unusual options activity, analyze their meaning, and craft trades designed to exploit these options flows.
Stop pounding away at the tape with a flimsy gameplan.
Check out Block Hunters and learn how today’s traders play the tape like the pros.
Brandon Chapman, CMT
Creator of Ghost Prints