
Hey trader,
This business runs one cruel trick on everybody. It shows you a clean breakout, then yanks it back the second you buy.
It’s made a monkey out of me too. Nobody in this game is immune.
The stock reverses $7 in your face.
That’s the fastest money you’ll ever lose. The cause is almost always the same.
You read the chart wrong.
Getting it wrong compounds fast. You chase the fake into a zone that resets while you sit there.
Now you’re trapped on the wrong side for six months.
Today I’m handing you the cure in four simple steps. You’ll define the move, draw the levels, confirm the clues, then read the trigger.
By the end you’ll separate a real breakout from a sucker’s bet in seconds.
Step 1: Know What You’re Looking At
A breakout means the price is moving up. That’s bullish.
A breakdown means the price is moving down. That’s bearish.
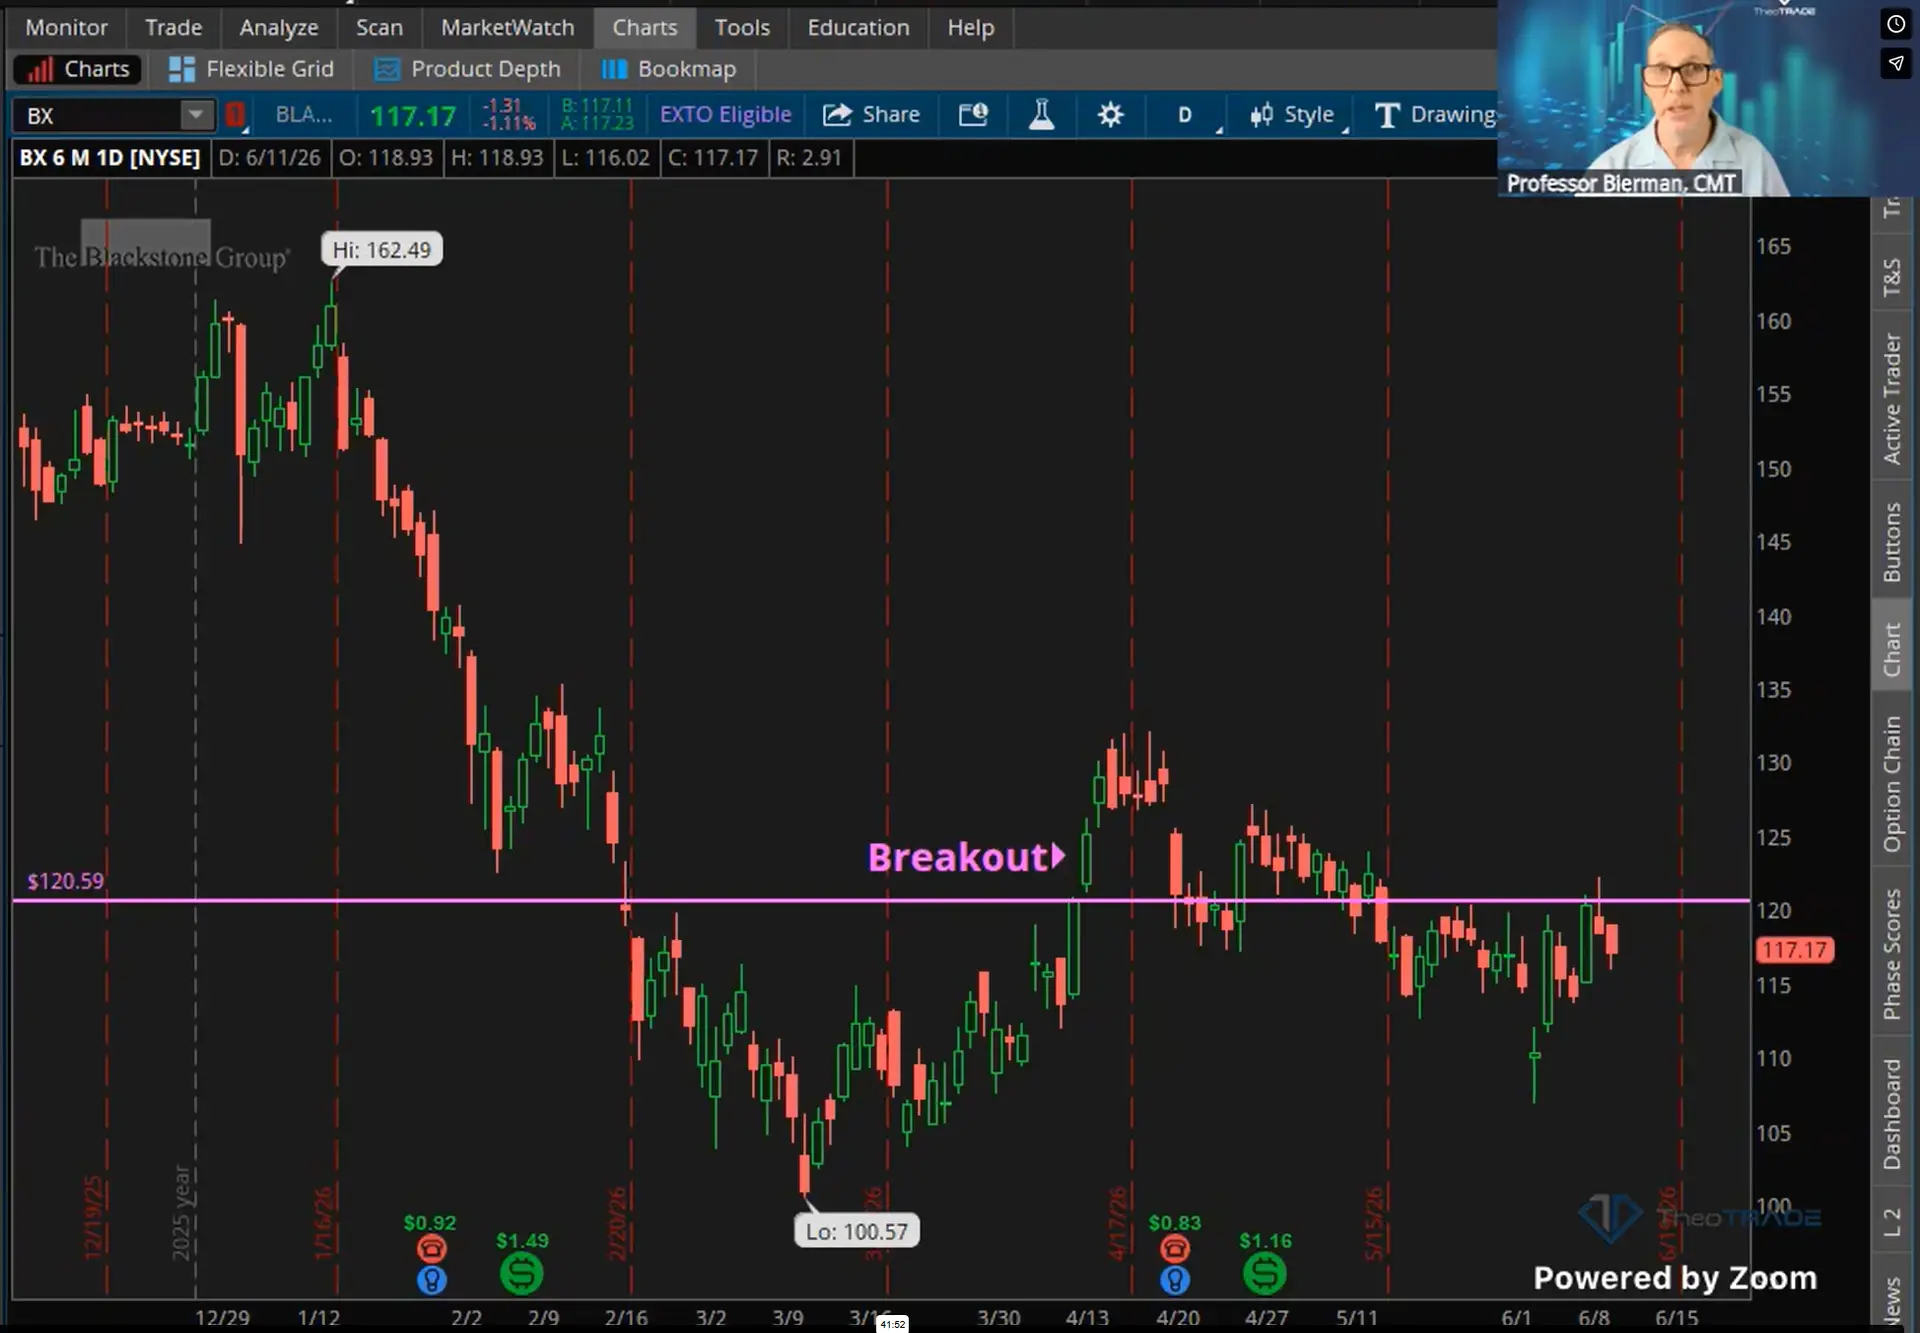
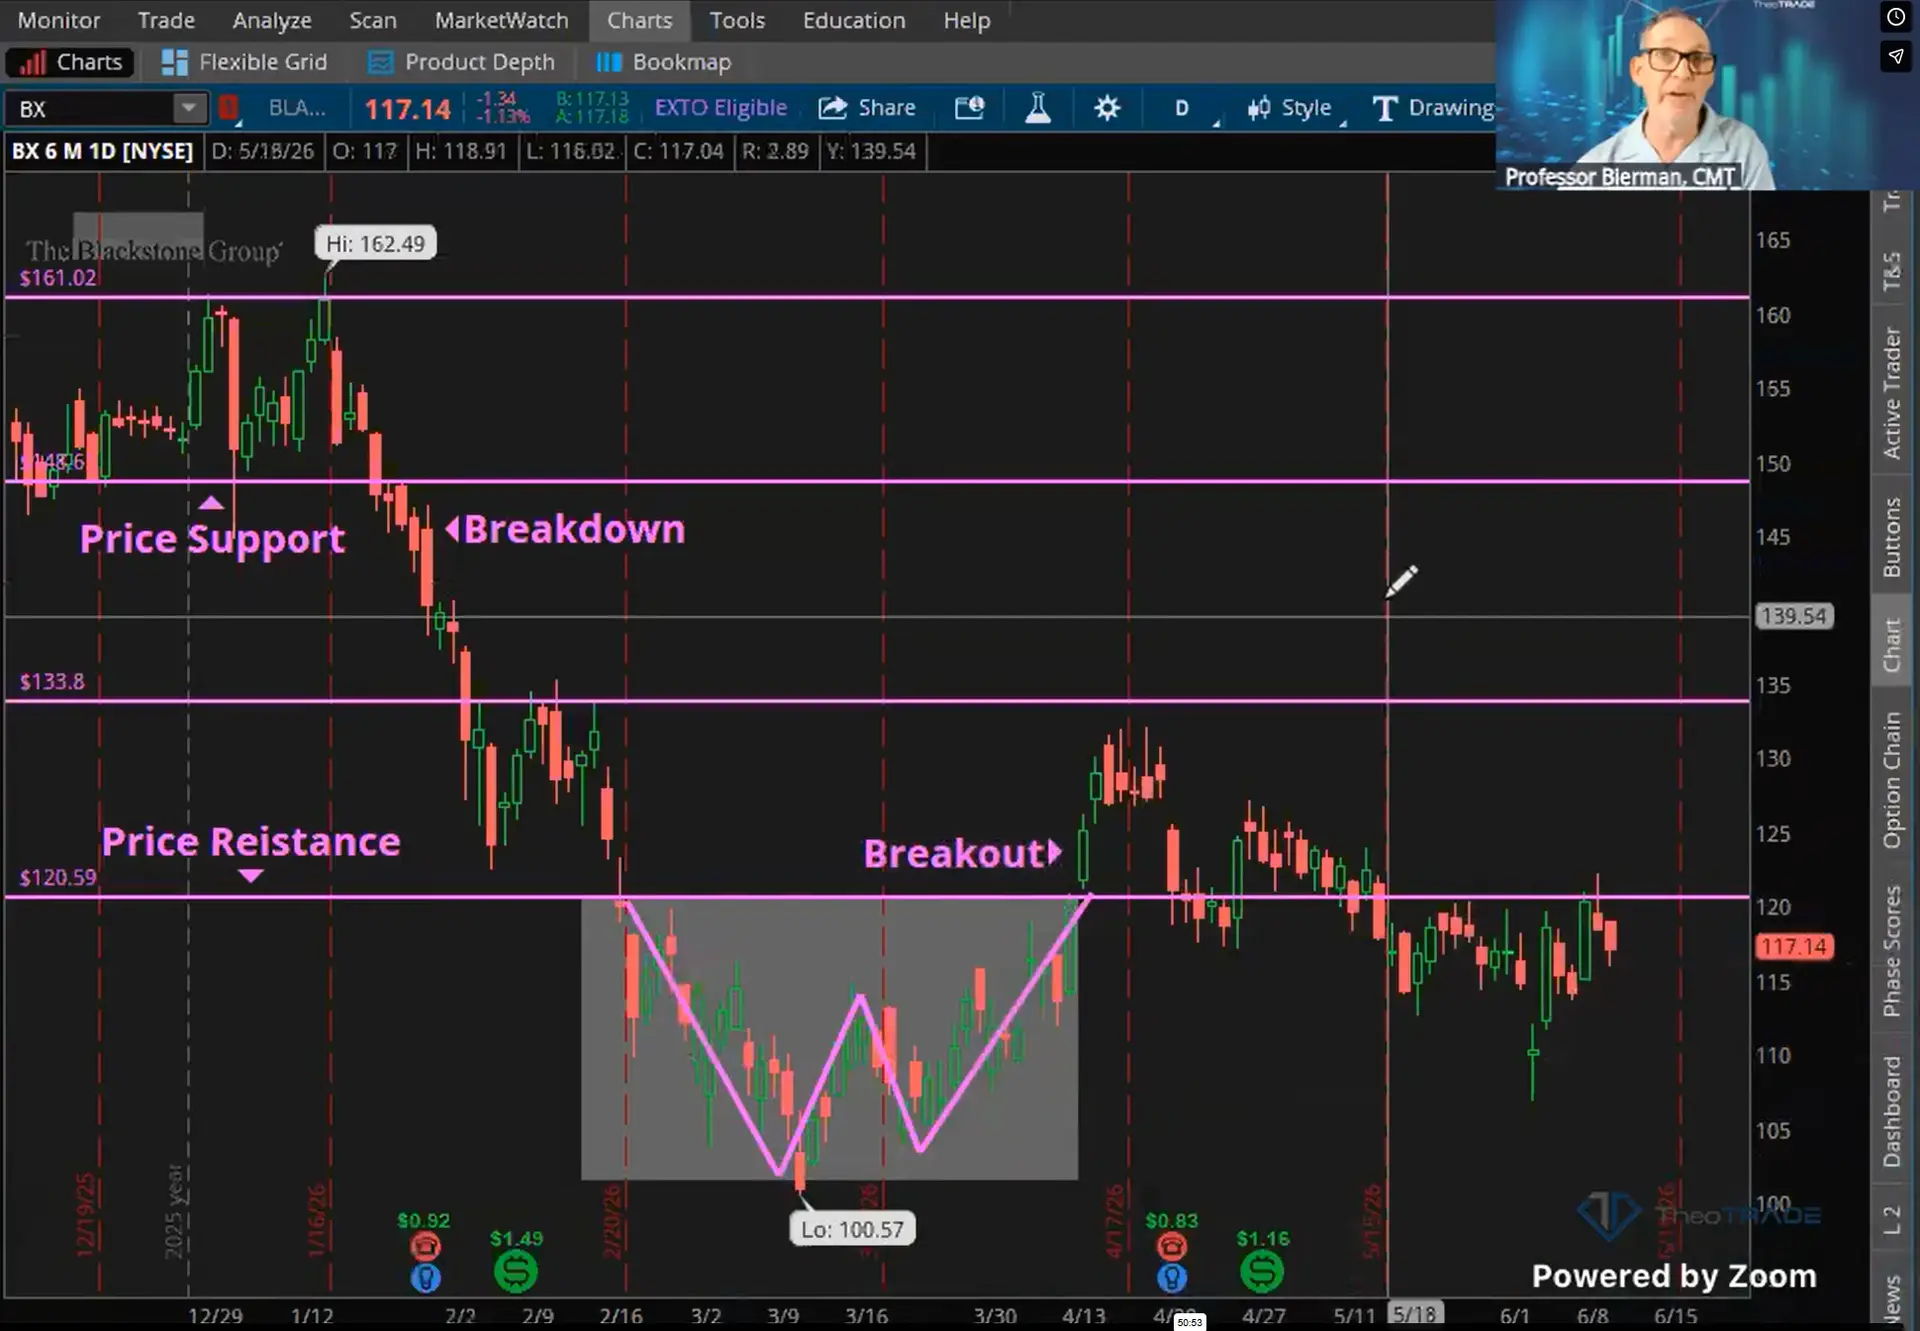
A breakout happens when price moves decisively above a defined resistance level.
Decisively is the key word. A real one carries heavy volume, an outsized candle, and a fat spike in money flow.
Support is your floor. Buyers step in to defend it. Resistance is your ceiling. Sellers wait up there to fade it.
A breakdown is the mirror image. Price punctures support and stair-steps lower.
Picture a horse locked in a barn. The breakout is the moment it bolts.
Step 2: Draw Your Levels With Two Tools
The price level tool comes first. It lays down your horizontal line in the sand.
The icon is a dollar sign sitting over a line.
Click it once to turn it into a pencil. Click again to lock the line in place. Then open Edit Properties.
Turn left extension and right extension On. Then click Save as Default.
That single setting matters most. Every line you draw now runs the full width of your screen.
The channel tool comes second. It draws the sloping levels for you. The protocol is click, drag, click.
It builds a parallel channel automatically. The width of that channel is your risk.
I trust the horizontal level first. I bring in the channel to confirm it.
Step 3: Confirm the Breakout Is Real
A breakout needs real money behind it. I track money flow over raw volume. Volume stays blind to direction. Money flow reveals it.
You’ll watch a stock pop. Then you check the flow underneath. The price rose on nothing.
That’s usually a gamma squeeze finishing up. The shorts are buying back the gamma supply.
The real buyers left long ago. The pop is sitting on a vacuum.
Before I commit, I run through the clues:
- The candle shows conviction when it prints unusually large.
- The slope keeps you safe when flat and warns you when it turns down.
- The money flow confirms real accumulation or exposes an empty pop.
- The price gap signals a serious repricing of risk.
No single clue earns you the trade. You need a confluence of them.
Without that confluence, you’ve placed a sucker’s bet.
Step 4: Read the Level Like a Stop Sign
These levels predict nothing. I never predict squat.
They act like a stop sign instead. It shows green, yellow, or red.
Price stalls at resistance. Call that yellow.
Price fails there and rolls over. That’s your red light to get out.
Price holds and pops back up. Call that green.
These are escape hatches, nothing more. They reveal the trap doors before you fall through one.
Run these four steps before you touch a breakout. You’ll spot the real ones long before they cost you a dime.
Professor Jeffrey Bierman
Creator of the Genesis COG System