Hey trader,
Everyone is watching the same stocks.
They’ll all miss the fastest moves of the year. And I can prove it.
Strip out semiconductors and AI from the S&P 500 and the index is down 2,000 points.
Every single thing in between has already crashed: Hardware, software, retail, industrials…all of them.
But you’d never know that by watching the popular names on your screen.
Managers keep chasing 52-week highs in two sectors while liquidating everything else at 52-week lows.
There are zero healthy rotations. That’s where you want to be.
One of the easiest ways to find them is to follow the Burn Signal.
But we’ll get to that in a minute.
Because right now, I want to explore the stocks that have the best value popping up on my radar.
Nobody Is Doing the Math
I told my audience this morning that this market is a cat and mouse game.
It looks like it’s rallying. It’s not.
Managers are chasing performance at 52-week highs in two sectors.
Everything else is getting dumped at 52-week lows. Analysts are downgrading at the bottom instead of at the top.
On Friday, an analyst downgraded a stock at its 52-week low. The PE was six.
If that person worked for me, their security card would be gone before lunch.
You downgrade at 60. Not at 6. At six times earnings, the bad news is already baked in.
That’s the whole market right now. Nobody’s doing the math. They’re trading off charts and algorithms instead of fundamentals.
Consumer staples are at 2x-3x earnings. The crowd doesn’t see value there because the charts look terrible.
The charts are lying.
Here’s how you tell the difference between what’s actually cheap and what just looks cheap.
Goldman Sachs Is Real Value
Goldman reported $17.55 in earnings this morning. The stock dropped 24 points.
Sounds bad. It’s not.
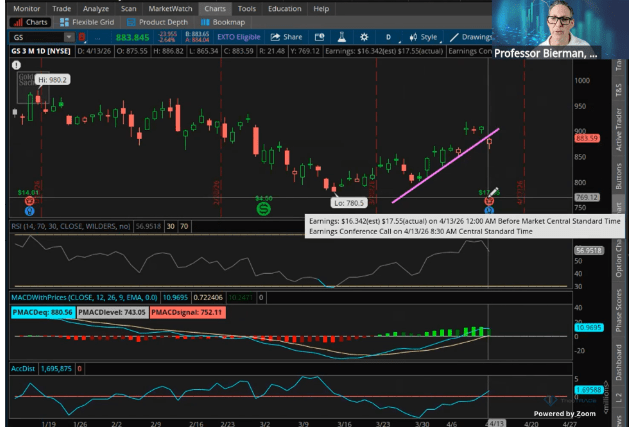
Twenty-four points on an $850 stock is 2.5%. That’s nothing.
The multiple dropped below 15. I told my audience that if Goldman’s multiple got to 10 or 12, I’d mortgage my house and buy the entire company.
I call Goldman a sacred cow. I would never short it.
The play is simple: Let it correct back to 780 and re-enter. At a 15 multiple with those earnings, the math is on your side.
That’s how you evaluate value.
You don’t see “Goldman down 24 points” and panic. You contextualize the move, run the math, and find the level where risk reward works for you.
Goldman is exactly the type of name the crowd ignores when they’re busy chasing semiconductors. It’s quiet. It’s pulling back. Nobody’s talking about it.
Those are the setups I live for.
Nike Is the Trap
Now compare that to Nike.
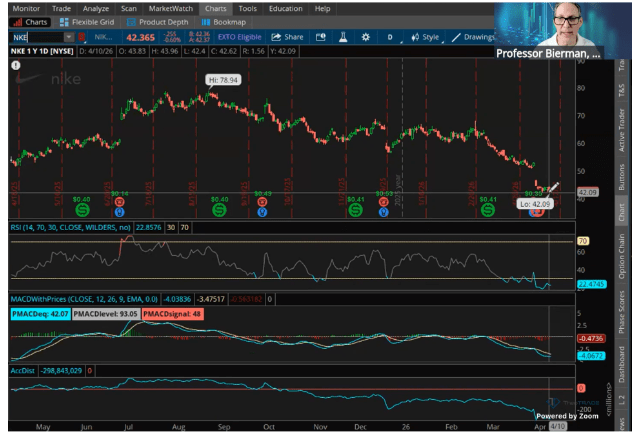
Nike is at $42. The chart looks oversold. A lot of traders asked me if it’s a buy.
It’s not.
The multiple is 27x earnings. Revenue is falling. Earnings are falling. When both are declining at the same time, that’s the kiss of death.
I won’t pay a dime for Nike above book value. That’s somewhere around $10 to $20. At $42, there is no floor.
Same logic applies to Fastenal. It reported 30 cents this morning. Roughly 10% growth on a 42 times multiple. I’ve been short this stock for weeks. Once it broke the momentum channel, it became the easiest short I’ve had in my career.
The chart told momentum traders to buy. The math told me to short. The math won.
A stock that looks cheap on a chart is not the same as a stock that’s cheap on its fundamentals:
- Goldman at a 15 multiple with $17.55 in earnings has a floor. Let it pull back to 780 and the risk reward tilts in your favor.
- Nike at 27 times with declining earnings and revenue has no floor. The chart says oversold. The math says it’s still expensive.
- Fastenal at 42 times with 10% growth is a bubble. That’s not a dip. That’s a short.
If you can’t tell the difference, you’ll buy every trap the market sets this year.
How You Stay Ahead of This
The rotation into neglected value names hasn’t started yet.
When it does, you won’t hear about it on CNBC. You won’t see it in a chatroom recap. By the time those tickers show up in your feed, the fast money will already be made.
That’s the problem the BURN SIGNAL was built to solve.
Every week, I scan over 200 stocks for the Smoke Pattern, the Heat Gauge, the Fuel Line, and the Draft. When all four confirm on the same quiet chart, the alert lands in your inbox before the move becomes obvious.
You don’t need to scan 200 stocks yourself. You don’t need to guess which neglected name is about to move. The BURN SIGNAL does the work. You get the ticker, the signal, a stock trade, and an options play. Twice a week.
A BURN SIGNAL is forming in my watchlist right now. The first alert goes to the people already inside.
Join BURN SIGNAL Alerts Before the Next Signal Fires →
Professor Jeffrey Bierman
Creator of the Genesis COG System