Hey trader,
An inverted yield curve warned of every U.S. recession from the 1970s through 2020.
Then the 2020s handed us the longest inversion on record with no recession behind it.
It baffled me. So, I spent part of this past week digging back through that history.
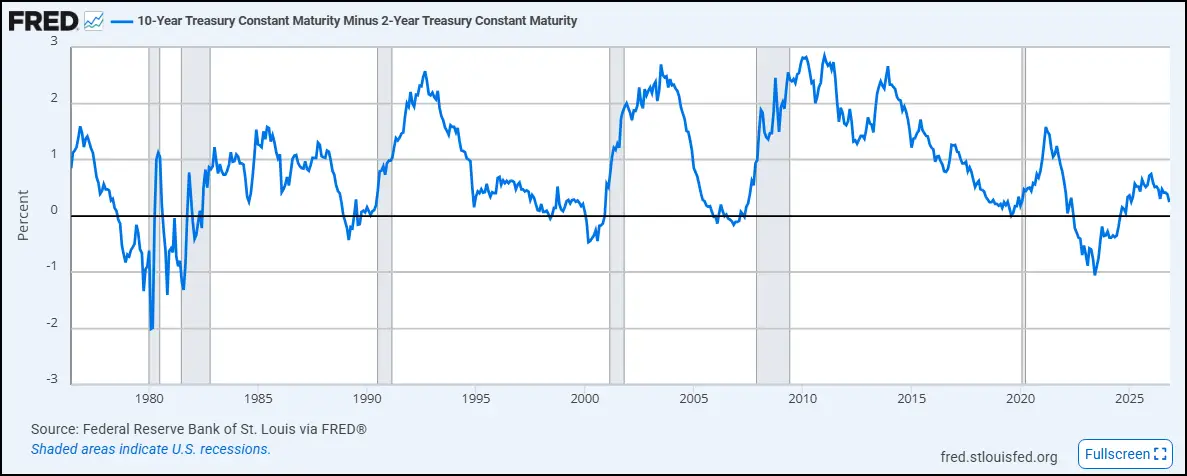
The curve has a habit of flashing a warning 18 to 24 months before recessions and bear markets show up.
The yield curve compares what the government pays to borrow over different lengths of time. Wall Street watches the spread between the 10-year and 2-year Treasury yields most closely.
The 10-year normally pays more than the 2-year because lenders want extra compensation for tying up their money longer.
When the 2-year yield climbs above the 10-year, you get an inverted yield curve. That usually means the Fed has tightened hard enough to put real stress on the economy.
Rising short-term yields are how every inverted yield curve starts.
If the Fed moves with intention to raise rates, short-term yields climb first.
That’s why I check two numbers I check every week to see whether we’ve hit the danger zone.
But a signal is nothing without knowing what to do next.
That’s why we’ll dig into my plan for when the curve tips negative.
Now, to read the curve today, you need to see how it behaved over the last four decades.
Let’s start in the 1990s.
The Inverted Yield Curve’s Recession Track Record
The 1990s opened in the shadow of a late-1989 inverted yield curve (Black Monday and all). The economy slipped into the 1990-1991 recession. The Fed cut short-term rates aggressively and pulled the curve back into positive territory.
By mid-1992, the 10-year minus 2-year spread peaked near +2.60%. The Fed kept short-term rates low to help troubled banks repair their balance sheets.
In 1994, Fed Chair Alan Greenspan doubled the fed funds rate from 3% to 6% over twelve months. The curve flattened into a narrow band between +0.20% and +0.50%.
Growth cooled without a recession. Greenspan pulled off a textbook soft landing.
The 2000s delivered two warnings in a single decade.
In February 2000, persistent Fed hikes created an inverted yield curve. The tech bubble peaked just weeks later.
The Fed eventually cut short-term rates from 6.5% all the way down to 1%. The curve steepened dramatically.
Then, between 2004 and 2006, the Fed raised rates to cool an overheating housing market. The market had an inverted yield curve again by early 2006. It stayed flat or negative through mid-2007.
Some analysts dismissed that inverted yield curve as a side effect of heavy foreign buying of U.S. debt.
The 2008 Global Financial Crisis proved them wrong.
The Inverted Yield Curve That Broke The Rule
With short-term rates anchored at zero after the crisis, the spread hit a modern high of roughly +2.91% in early 2010.
The Fed began raising rates in late 2015. Low global inflation held long-term yields down while short-term yields climbed. By late 2018, the spread had shrunk to nearly +0.10%.
In August 2019, the market briefly saw an inverted yield curve. The Fed pivoted to rate cuts just months before COVID-19 hit.
The 2020s then tested the yield curve like no other decade. Here’s how the 2022-2024 stretch played out:
- The spread inverted in July 2022 as the Fed launched its most aggressive hiking cycle since the 1980s
- It plunged past -1.00% in 2023, the deepest inversion since 1981
- It stayed inverted for roughly 26 months, until September 2024, shattering the prior duration record
The economy “officially” avoided a recession despite the deepest inverted yield curve in four decades, but really, they just changed the definition because there were two negative quarters of GDP in 2022.
Nonetheless, consumers kept spending. Corporations and homeowners had locked in fixed-rate debt during the 2010s. Higher rates took far longer to bite as a result.
Steady labor markets did the rest. As inflation cooled and the Fed started cutting in late 2024, the curve normalized.
It’s settled into a modest positive spread of roughly +0.25% to +0.60% through 2025 and 2026.
What I’m Watching Now
The yield curve has evolved from a textbook recession predictor into a reflection of global capital flows and central bank policy.
The 2020s proved that structural shifts in debt and monetary policy can bend Wall Street’s most trusted rule.
I’m not throwing the tool away. The inverted yield curve still has a track record that stretches back to the 1970s, and one exception doesn’t erase it.
While the curve hasn’t inverted yet, a spread between +0.25% and +0.60% leaves very little cushion, though.
The Fed raised rates into the 2000 inversion. It did it again before 2006 and 2022. Each time, the 2-year yield climbed until it overtook the 10-year.
Pull up the 10-year minus 2-year spread and check it every week. Pay close attention to the 2-year yield after every Fed meeting.
If the spread drops below zero, treat the inverted yield curve as a warning with an 18 to 24 month fuse. That fuse gives you time to plan your defense well before stocks feel it.
I’ll keep you posted the moment the curve moves.
Talk soon,
Gianni Di Poce