
Weak PPI Report Signals No Rate Cuts
Just like headline CPI, headline PPI was up because of energy prices. It increased from 1.1% to 1.3% which met estimates. Commodities inflation has been low in the past few years as most inflation has been coming from wages. PPI excluding energy and food fell from 1.3% to 1.1% which missed estimates for 1.4%. That was the lowest core PPI since August 2016. Finally, core PPI excluding trade services was up from 1.3% to 1.5%. Trade services weighted on inflation.
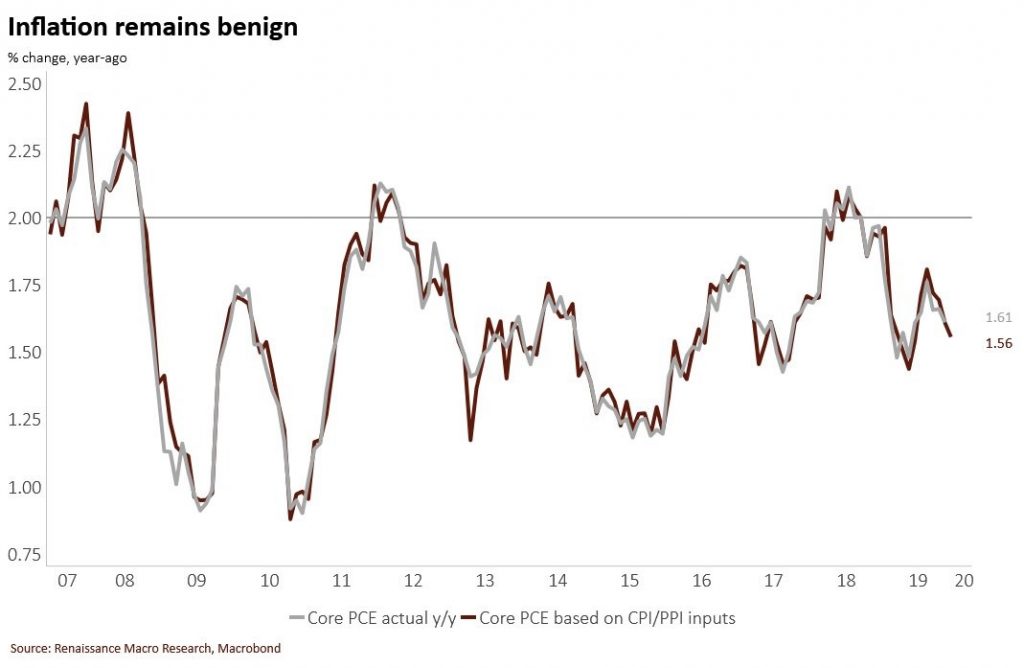
I look at PPI to project the other inflation reports. Sometimes PPI comes out before CPI and sometimes it’s the reverse, but they always both come out before PCE. We can use the inputs from the PPI and CPI reports to predict PCE inflation. This explains why PCE inflation rarely beats or misses estimates by a large margin. That’s the same reason consumption data doesn’t come in wildly away from estimates as we already have the retail sales report.
As you can see from the chart below, based on PPI and CPI inputs, December core PCE inflation will fall to 1.56%. That core PCE inflation is nowhere near enough to cause the Fed to hike rates. If anything, low inflation will cause the Fed to raise them. Core PCE inflation hasn’t been above 2% for most of this cycle. The Fed’s goal is to have sustained inflation at 2% which it has failed at achieving. This environment with low inflation and low unemployment has worked out for consumers this cycle. If it wasn’t for wage inflation, it would be perfect for firms. We saw margins contract especially at small firms in 2019 even though PPI was low.
Beige Book Report
The latest Fed Beige Book report measured economic data in the final 6 weeks of 2019. In other words, the holiday shopping season. The Beige Book showed that businesses are worried about the trade war with China. The good news is Phase 1 of the trade deal is complete, but the bad news is Fed members stated firms’ concerns won’t be gone until Phase 2 is complete.
The chart below shows the targets for U.S. exports to China. Personally, I’m skeptical of them being met because China hasn’t purchased as much agriculture products as it said it would in previous agreements and because these are aggressive goals. The Fed stated there were low profit margins because of tariffs on raw materials. That’s probably fair for some firms, but keep in mind commodities inflation has been low. Wage growth was more of an issue in 2019.

Solid Retail Sales Report, But Not Great
The December retail sales report can either look very strong or very weak depending on the time horizon you use. Ultimately, I think this was an ok report. It signals the economy kept growing and probably won’t have a major impact on Q4 GDP growth estimates. For instance, Oxford Economics is still predicting 2.2% growth. That being said, 1.3% of growth is being driven by trade in their model. Real final sales growth will be weak. The retail sales report wasn’t the great report I was expecting, but it wasn’t bad either.
Specifically, monthly headline retail sales growth was 0.3% which missed estimates for 0.4%, but November growth was revised 0.1% higher to 0.3%. Retail sales growth excluding autos was 0.7% which beat estimates for 0.5%. The November report was revised down 0.1% to 0%. As I mentioned in a previous article, auto sales growth was weak in the latest motor vehicles report which meant autos and auto parts retail sales growth was likely to disappoint. Excluding autos and gas monthly growth was 0.5% which beat estimates by a tenth, but November’s reading was revise down by 2 tenths to -0.2%. Finally, control group sales growth was 0.5% which beat estimates by a tenth, but November’s reading was revised lower by 2 ticks to -0.1%. You can already see how this report can be interpreted 2 different ways. Either you can say, most readings beat estimates or you can say most revisions were negative. That’s why this was a mixed report.
Quarterly growth is much weaker than last quarter because October and November had downward revisions, but yearly growth was strong. Quarterly growth had a very tough comp and yearly growth had a very easy comp. Q4 had annualized quarterly growth of -0.3% before revisions. However, growth averaged 7% in Q2 and Q3 which was unsustainable. On the other hand, as you can see, from the chart below, the 3 month average of yearly growth was 4.1% which is a 13 month high. Year over year control group sales growth was 6.34% which was a new cycle high as it increased from 2.51%. That’s all because December 2018 was a cycle low in yearly growth. Yearly growth would have been amazing if Q2 and Q3 lapped that reading. That’s partially why there was strong quarterly annualized growth earlier in the year.

Yearly retail sales growth excluding food services increased from 3.15% to 5.96%. The 2 year growth stack went from 7.1% to 7.04%. As you can see, there wasn’t much change in results. All these changes to comps and revisions amounted to little change in the trend. Total retail sales growth went from 3.33% to 5.83% and the 2 year growth stack went from 7.41% to 7.34%. Once again, there was little change. Finally, real retail sales growth went from 1.26% to 3.46% and the 2 year stack fell from 3.11% to 3.04%.
Within the retail sales report, yearly motor vehicle sales growth fell from 6.62% to 4.46%. That decline which I previewed in a previous article, prevented this from being a great report as this category is 20.14% of total sales. As I also predicted, non-store retail sales growth was fantastic. Yearly growth improved from 8.74% to 19.2%. As you can see from the chart below, online sales are almost as big a share of retail sales as general merchandise stores as the former has 11.19% share and the latter has 11.33% share. Online sales will soon need to be broken down because almost everything will be within the category.

Recent Comments