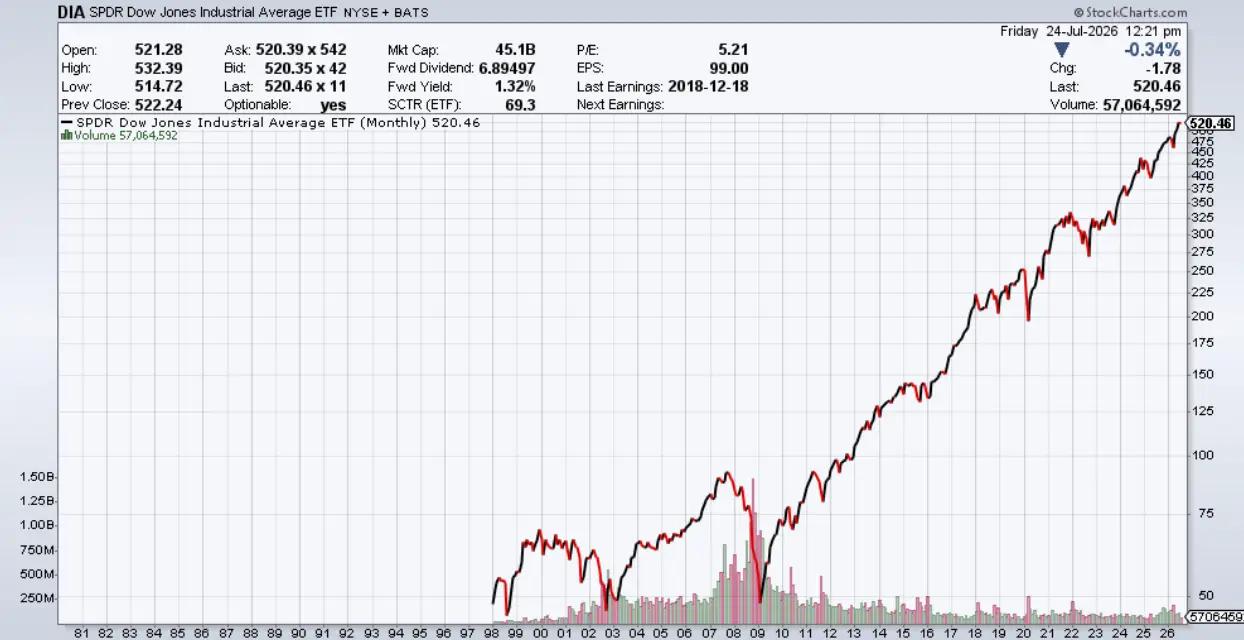
Go pull up a chart of the QQQ on the max setting. Put the Dow right next to it.
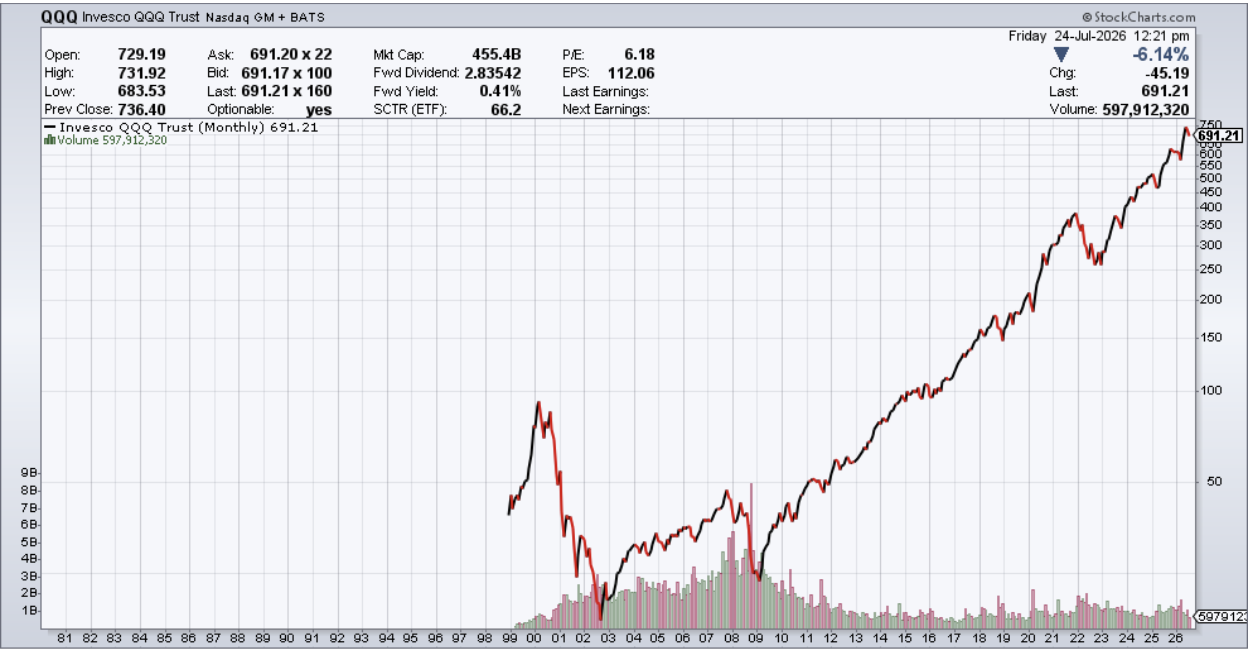
Find March 10, 2000. NASDAQ tops out at 5,048. Now walk it forward and watch what these two do.
Tech starts coming apart. And the Dow goes higher.
Money leaves the red-hot stuff and shows up in financials, industrials, energy, materials. Day after day it’s the same picture on your screen. NASDAQ red, Dow green, money moving from one side of the room to the other.
You know what everybody called that at the time? Healthy. The money’s not leaving, it’s rotating.
So what happened?
The NASDAQ dropped 78% over the next two and a half years. The Dow gave up about 37%. Nobody got saved by the rotation. It just moved the pain around for a while.
And look at the bounces in there. Wicked violent rallies inside a market that’s going down. Those took the head off a lot of traders, because you get one of those and you start thinking maybe it’s over, and then the next leg shows up.
Now come back to right now.
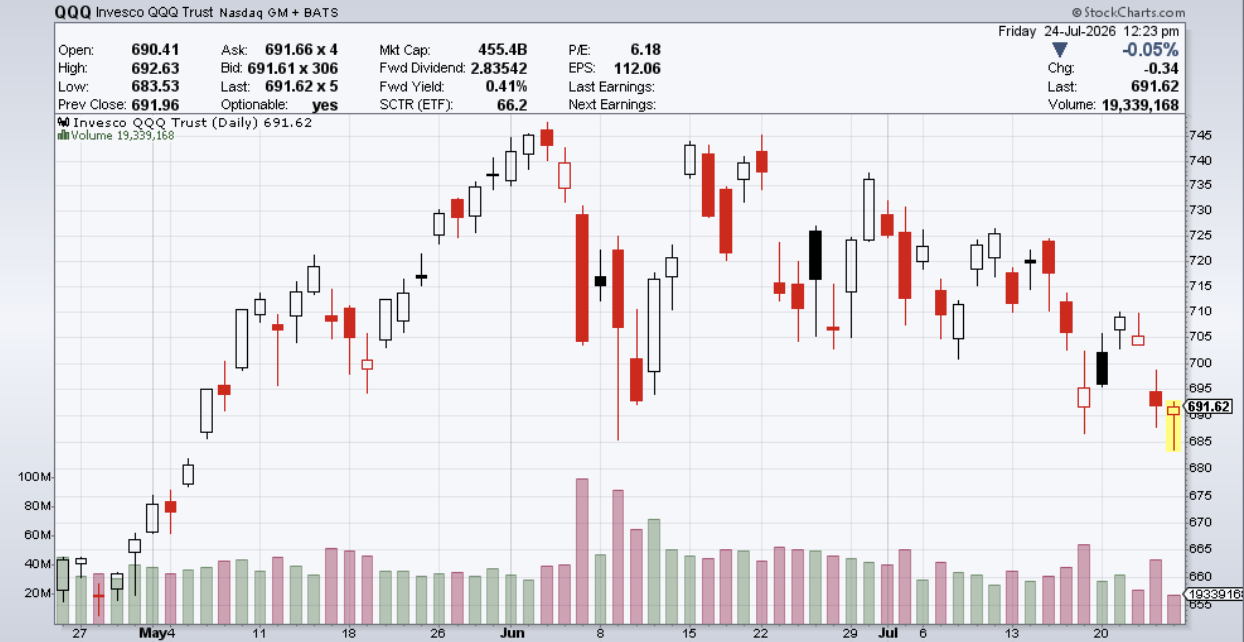
You’ve got an advance-decline line screaming higher with the S&P down. Somebody’s going to tell you that’s constructive. Is it?
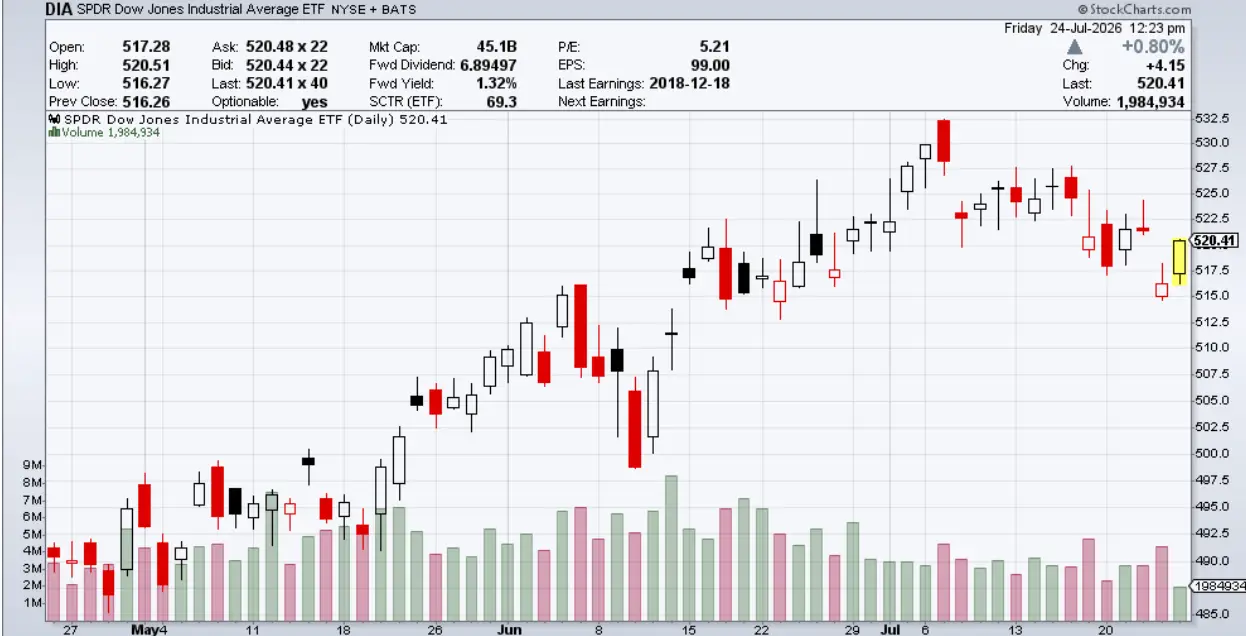
Here’s what you’re actually looking at. It’s July. Most portfolios are negative on the year and the S&P is up 8%. Those managers have to show a number, so they’re chasing whatever moved yesterday. That’s not conviction. That’s a guy with a performance problem.
Nobody on CNBC comes out and goes, the majority of portfolios suck this year. But that’s the situation.
This is like looking in a mirror, but 20-some years later.
What do I want to see out of an advance-decline line? Higher degrees of correlation. When things start moving together I know what I’ve got.
When capital is sloshing around from one corner to another every couple of days, and the index looks fine while the stuff underneath it doesn’t, that’s a different animal entirely.
Rotations are a humongous negative. They feel healthy because the money stays in the market. It just won’t sit anywhere.
And here’s what I want you to take from this, because you don’t need to predict anything to use it. Stop reading a green index as an all-clear when the money underneath it can’t hold still for two days.
In 2000 the rotation ran and ran, and then it stopped. When it stopped, everything went down together. That’s the order it happens in.
Where do you think we are in that sequence?
This is why I’m sticking to trading, taking small bets in this mess vs. trying to put long term positions.
But here’s the thing about small bets…
They only work if you don’t step on a landmine.
Because in markets like this… one bad trade can wipe out 10 good ones. And most traders blow themselves up not because they’re wrong about direction… but because they skip the basic checks that would’ve flagged the setup as broken before they ever hit “buy.”
That’s why I put together a 60-second pre-trade checklist. Five quick checks. Takes about a minute. Catches the stuff that quietly kills accounts.
Things like:
→ The five-second question that separates traders who stick around from traders who get carried out…
→ Why the “safety net” you were told to rely on (the stop-loss) can fail you on the exact day you need it most…
→ The silent cost bleeding out of your trade every single day… even when you’re 100% right about the stock…
→ The simple sizing check that decides whether a loss is something you shrug off… or the one you don’t come back from…
→ Why the very first trade most beginners are taught is the most dangerous one on the board… and the one-line test that flags it before you risk a dollar.
Normally this goes for $29.97. Today it’s free.
Get the 60-Second Pre-Trade Options Checklist here
Markets like this don’t forgive sloppiness. But if you’ve got a system… you can trade through it without getting wrecked.
To your success,
Don Kaufman