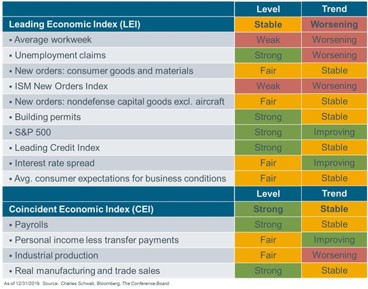
Leading Economic Indicators Disappoint
Leading economic index was weak, but not weak enough to show negative yearly growth which would be a recession warning. Monthly growth in December fell from 0.1% to -0.3% which missed estimates by a tick. Yearly growth was 0.1%. A few reports are showing growth was actually -0.1%, but I’m going with Bloomberg’s data. There are arguments to be made that this report was suppressed and arguments that it was lifted higher by unsustainable changes. Let's look at those.
Most obvious is the stock market which helped yearly growth by almost 1%. In other words, if you just use economic metrics, yearly growth was solidly negative. However, I think the stock market is an important leading indicator and also affects economic activity through reflexivity. When stocks go up, people who own stocks feel more confident and spend more money. The stock market helped the index by the most since the beginning of the expansion (2009) because stocks bottomed in December 2018.
Comp won’t be as easy in 2020. However, stocks have rallied in January, so that’s not a huge issue. Plus, the overall index’s comp will get easier. That’s one of the main reasons yearly growth likely won't fall below 0% in 2020 even though it is currently precariously close to doing so.
Another obvious factor in this report was initial jobless claims. This metric only worsened because of the spike after the late Thanksgiving. Monthly initial claims were 233,500 in December. In January, they have fallen to 210,000. This metric will improve in the next report.
Finally, the ISM manufacturing new orders index was considered fair and stable. Kansas City index improved, but was negative and the Markit PMI fell, but was above 50. You can see in the table below how each factor impacted the leading and coincident indicators.
Leading ECRI Index’s Growth Rate Improves
Monthly ECRI coincident index is correlated with the leading economic indicators report. In December, it showed there was 1.5% growth which was down from 1.8%. That’s much weaker than expected. However, the expectation was from before the recent weak December economic data (excluding housing which has been strong) came out. The index was unchanged, but growth is what matters. Trough in the last slowdown was 0.9%. Just the leading economic indicators to see if its growth falls below 0%, I’m also following this index to see if its growth rate falls below that trough.
If the coincident index follows the leading index, it will improve in mid-2020. Will the economic turnaround be noticeable in Q1 or Q2? That’s the main question. Obviously, if it never comes this rally in stocks needs to be reversed harshly.
Just like the coincident index, the leading ECRI index didn’t move in the week of January 17th. Difference here is the yearly growth rate increased 0.9% to 5.2%. That’s the highest yearly growth rate since March 2018. Let’s see how it reacts to the stock market correction that may occur in the near term.

Kansas City Manufacturing Index Improves
Kansas City Fed manufacturing index was the 3rd regional Fed report to come out and the 3rd to show improvement, although it was still negative. December reading was revised up 3 points to -5 and the January reading improved 4 points to -1.
As you can see from the top chart below, the regional Fed index average is way above the December ISM PMI. Bottom chart shows the Markit manufacturing PMI fell as I will get to next. It’s still going to be above the ISM reading unless the ISM PMI really spikes.

Within the Kansas City Fed index, the production and volume of shipments indexes both fell 1 point to -4. The volume of new orders index exploded higher by 11 points to -2. The prices for raw materials index was up from 13 to 28. That’s interesting because oil prices have fallen. Year to date return in the CRB commodities ETF is -5.3%.
Expectations index also improved as it was up 5 points to 14. Production index increased 9 points to 23 and the volume of shipments index was up 14 points to 25. Unlike the current index, new orders fell 7 points to 9. Finally, the capex index stayed at 8.
Within the comment section of this report, there were 4 mentions of the trade war/tariffs. 1 was positive and the others were negative. A positive one stated, “The trade deals will help our business.” One of the negative ones stated, “Tariffs continue to reduce hiring, cap spending, sales and cash.”
Markit Composite Rises
Flash January Markit manufacturing PMI fell, but this was a great report because of services. Composite index rose 0.4 to 53.1 to a 10 month high. As you can see from the chart below, the services index rose 0.4 to 53.2 which also was a 10 month high. Manufacturing PMI fell 0.7 to 51.7 which was a 3 month low. This was different from the average of the first 3 regional Fed manufacturing reports which increased significantly. Manufacturing output index stayed at 52.4.
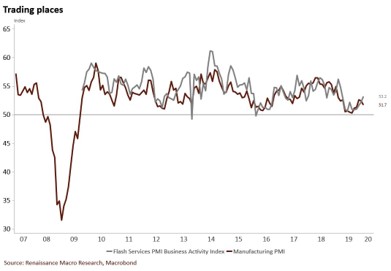
Rate of improvement in services new orders fell slightly. Sales increased for the 3rd straight month. Business activity and workforce growth improved. Expectations increased to a 7 month high. Input price growth was the highest since July. Output price growth was modest. Within the manufacturing sector, new business growth was marginal as domestic and international demand weakened.
New export orders were down for the first time since last September. Goods producers increased employment at the slowest pace in 4 months. Backlogs fell for the first time in 4 months. Input costs rose at a slower rate and output charges were only up slightly. The comment section of the Markit report didn’t include a prediction of job creation or GDP growth.
Recent Comments