
Hey trader,
The Nasdaq gave me a clean short signal today.
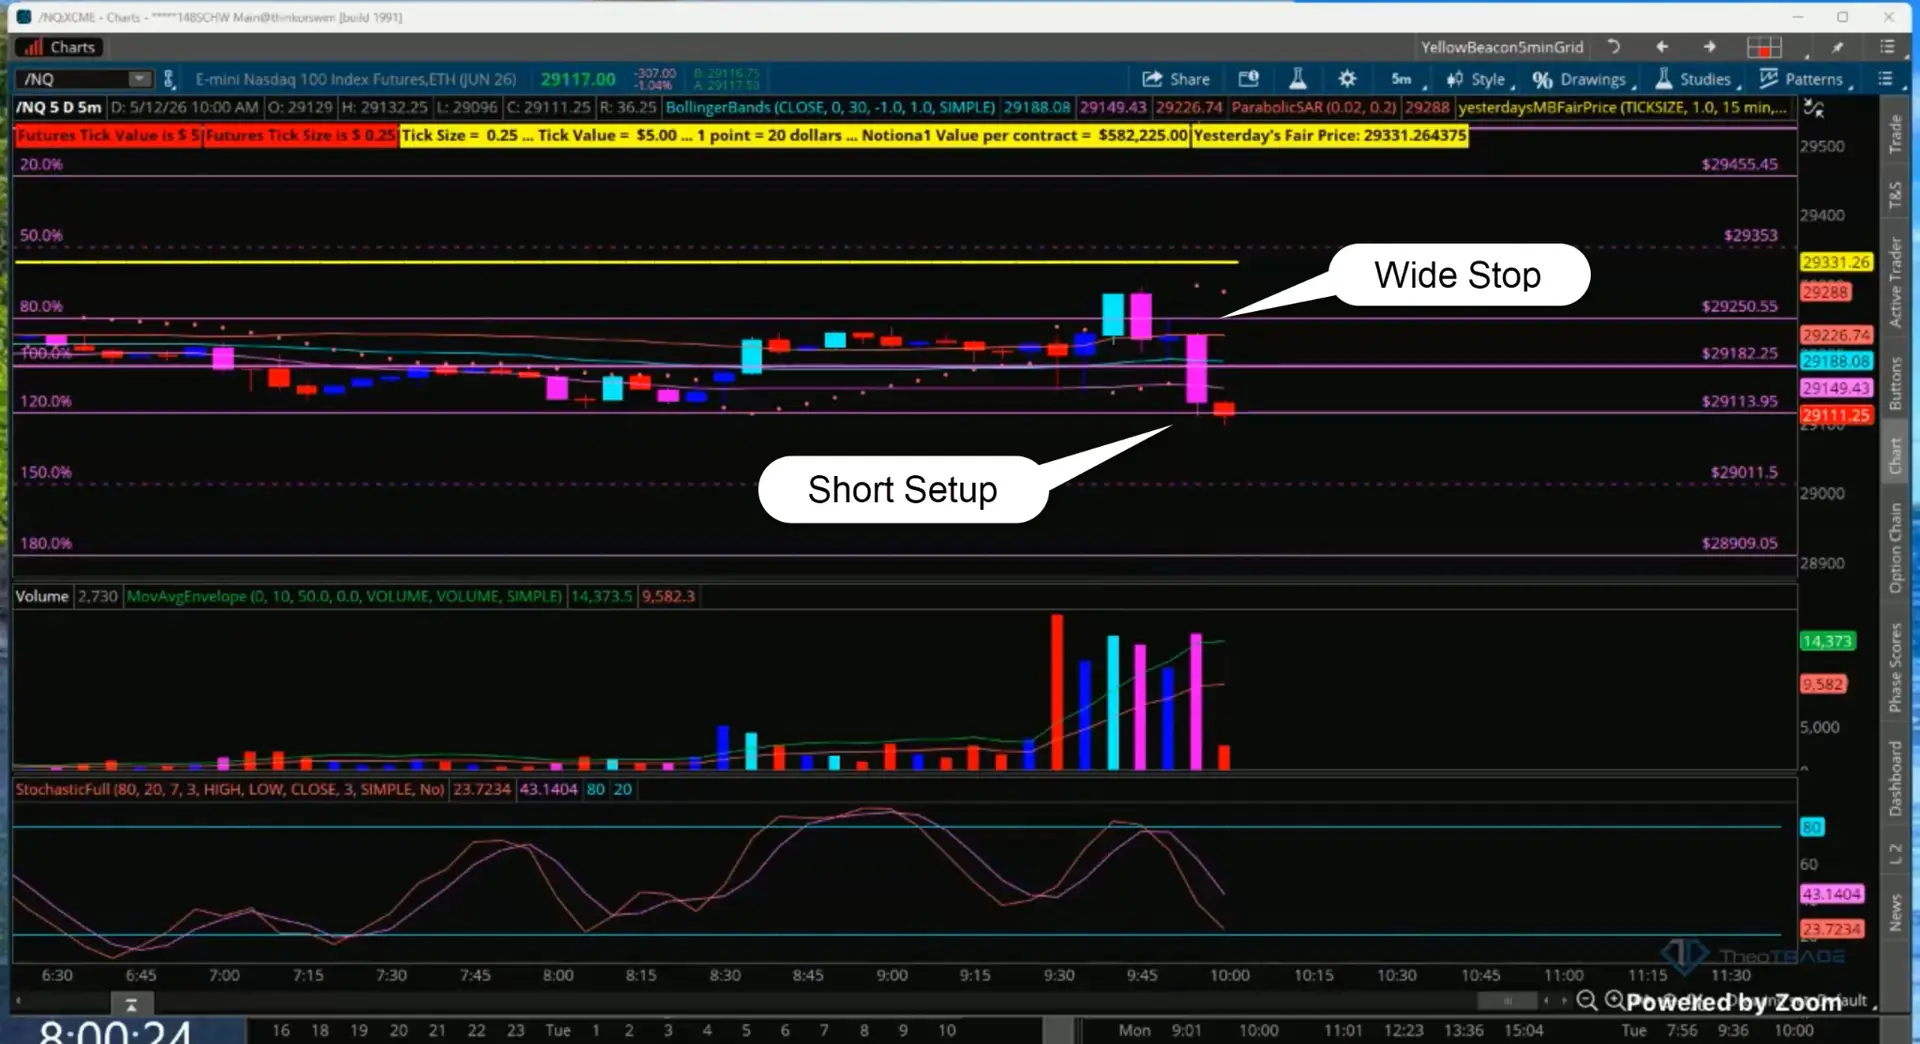
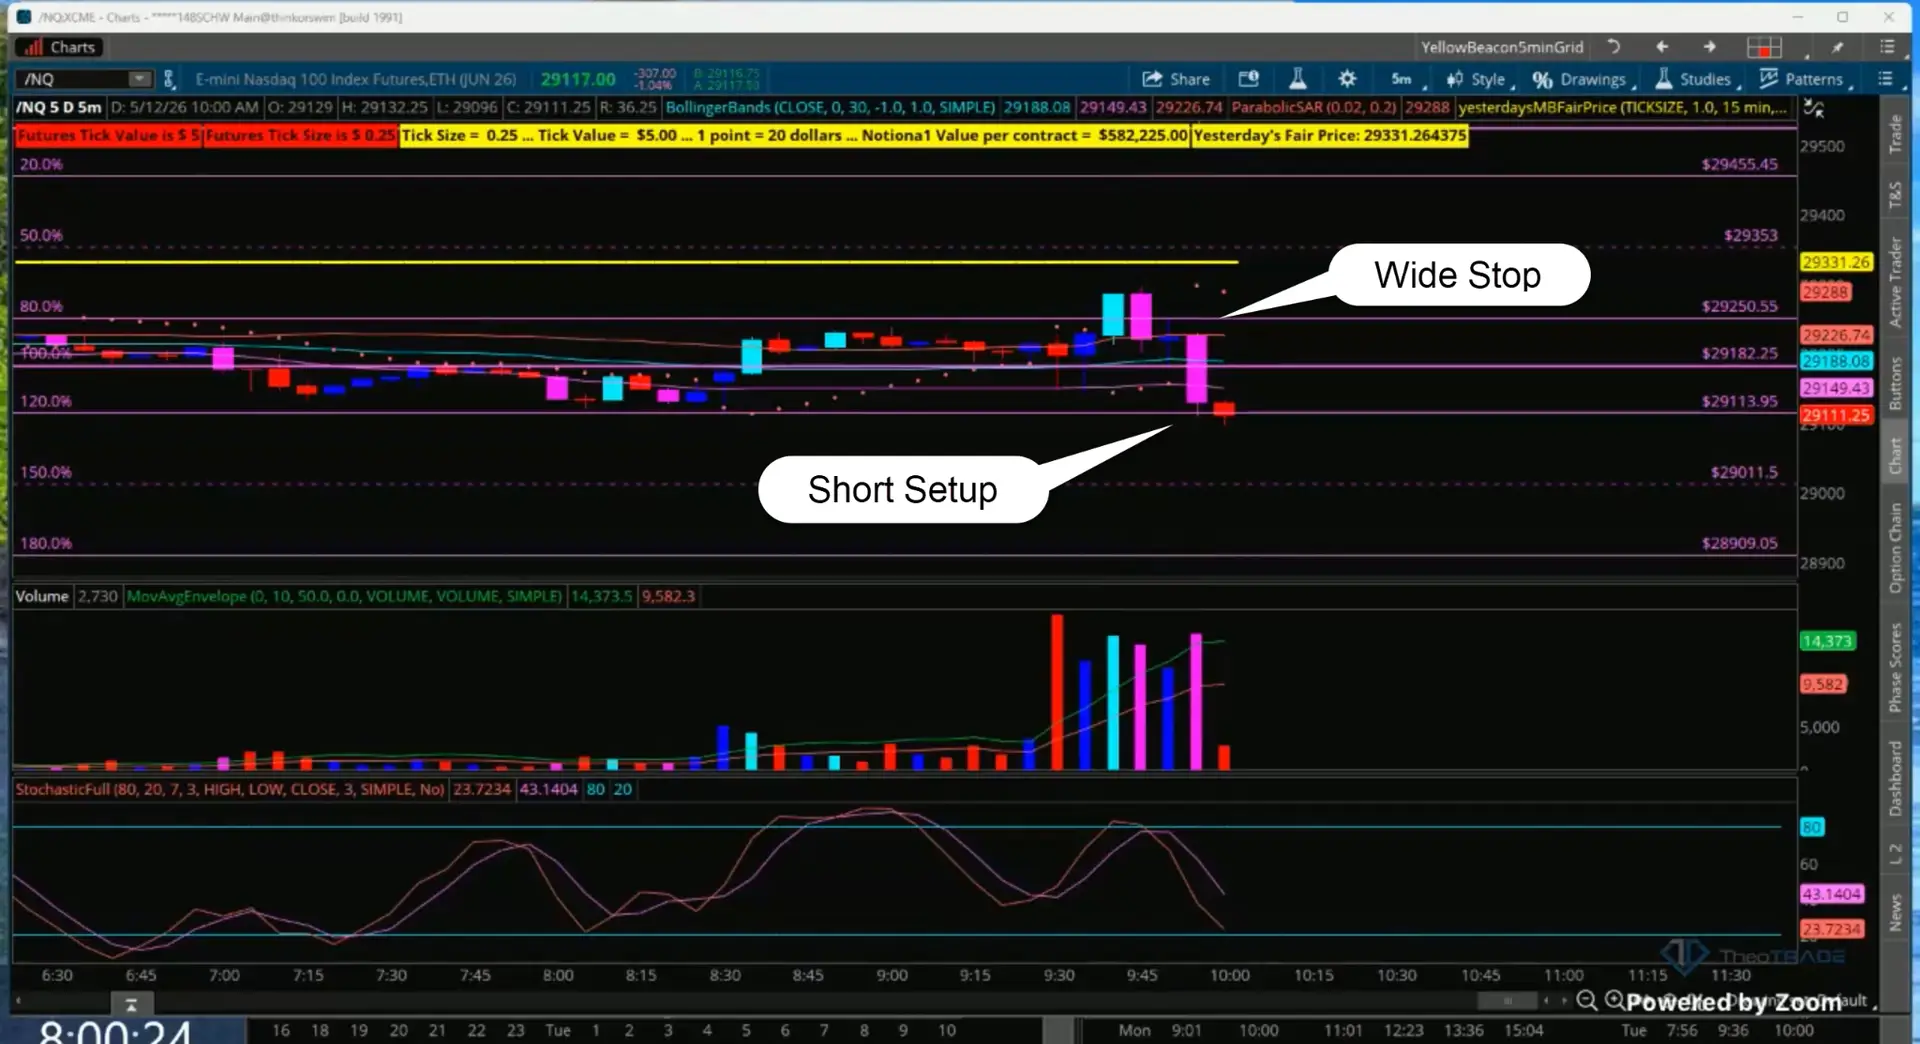
The setup included a Bollinger Band breakout, a one count reversal with follow-through, and a clear target.
I didn’t take it.
The reason had nothing to do with the pattern and everything to do with the math behind it.
The stop was 99.5 points wide.
On a $5,000 account, that puts the trade outside my band of acceptable risk no matter how clean the chart looks.
Here is the framework I used to make that call, and how to apply it in your own account.
A Signal Is Not the Same as a Trade
A signal tells you direction. The math tells you whether the trade fits the account in front of you.
Position sizing is what connects the two.
Skip that step and you end up taking valid signals that push you past your risk limits.
One bad break wipes out a week of work.
Treating every breakout the same is the trap.
A 20-point stop on the ES involves completely different dollar risk than a 100-point stop on the Nasdaq, even when both charts show the exact same pattern.
The chart looks identical. The exposure is wildly different.
What Happened on the Nasdaq This Morning
Price closed below the Bollinger Band on the ticks. The one count reversal had follow-through.
The pattern was textbook. Entry sat at 29,129.50 or better.
The stop needed to live above the high of the one count reversal at 29,229. From entry to stop, that’s 99.5 points.
On a Nasdaq micro contract, one point equals $2. That puts the dollar risk at $199 per single micro.
My framework on a $5,000 account caps single-trade risk near $100. The Nasdaq trade needed twice that just to participate at the smallest contract size available.
So I didn’t take it.
The setup was real, and the chart was clean. I told everyone in the room the signal was sitting there. If you traded a $10,000 account and were comfortable risking $200 on a single position, the trade was on the table for you.
For my account size and my rules, the math closed the door.
What Happened After
The Nasdaq did push lower off the breakout. Then it reversed back through the zero level and closed back inside the Bollinger Band before noon.
The trade that looked like a winner became a stop-out within the hour.
If I had taken the position just to be in the move, I would have eaten the full 99.5 point loss for nothing. The math saved the account before the chart ever had a chance to.
Three Things to Pull From This
Calculate your risk in dollars before you click. Points on a chart can deceive you, and a 50-point move on one instrument carries different dollar exposure than 50 points on another.
Run the dollars before you run the trade.
Set your maximum per-trade risk before the session opens, and write that number down somewhere you can see it. If a signal pushes past that number, skip the trade or reduce your size until the math fits.
Learn to pass on real setups. Skipping a clean pattern because the math doesn’t fit is the discipline that keeps you in the game long enough to catch the trades that do fit.
The Takeaway
Sizing is the thing nobody teaches and nobody wants to talk about. It is also what separates a $5,000 account that grows over time from one that disappears in six months.
Position sizing is the work you do before you ever click an order. Without it, even the best signals in the world will eventually take you out.
I would rather pass on a real setup and live to trade tomorrow than force a trade my account cannot absorb.
👉 Click here to learn more and join us.
Blake Young
Senior Market Strategist, TheoTRADE