Hey trader,
Copying what institutions do is harder than it looks.
The same trade structure they put on can cost the retail trader almost double if the strikes get picked wrong.
You’ve probably seen a clean institutional print land on a name and assumed you can mirror the structure at the same numbers.
On certain products, the skew built into the option chain makes that impossible.
Skew is the price tag the market puts on fear. When traders are more worried about a move in one direction than the other, the options on that side cost more in volatility terms than the options on the opposite side.
Oil is the most consistent example. Upside fear is permanently priced into the chain because geopolitics can spike crude overnight.
That permanent fear premium is why a retail trader mirroring an institutional bear trade at the same general strikes ends up paying almost the full width of the spread.
The institution structured around the steep part of the curve. The retail mirror lands on the same part and gets charged accordingly.
This morning the Block Hunter Console caught 10,000 USO contracts buying the June $136 puts and selling the $130 puts.
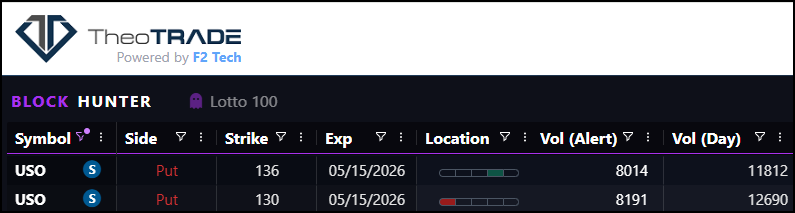
That is a bearish position targeting a return to where oil traded on May 7th.
The Console flagged it within seconds because the volume cleared the open interest at both strikes. That is the first job the Console does, surfacing real positioning from the noise.
The retail mirror at $138/$136 costs $1.00 for a $2-wide spread.
I’m going to show you the two adjustments that take this same trade from a $1.00 entry to a $0.60 entry without changing the direction or the catalyst behind it.
One sits on the chain itself. The other sits in the expiration window.
The macro setup behind both is building this week.
Here’s how it works.
Why Oil Skew Punishes The Retail Mirror
Skew is the reason the same trade structure costs different amounts on different products.
On oil specifically, downside trades and upside trades carry almost identical price tags even though they are betting in opposite directions.
The technical definition is the difference in implied volatility across strikes within the same expiration.
So, if say a put and call strike that are $2.00 away from current price have the same cost, there is no skew. If one is more expensive, there is skew to that side.
The oil curve slopes hard because the market prices in geopolitical risk on the upside that the downside does not carry.
Every put strike below the current price gets discounted in volatility terms relative to the call strikes above it.
That is the structural reason a bearish spread on USO costs roughly the same as a bullish spread at equidistant strikes.
The institutional position bought the $136 puts and financed them by selling the $130 puts.
The buy leg sat in the steepest part of the curve, and the sell leg landed in the flatter portion below it.
The retail trader looking to mirror that structure at $138/$136 ends up buying premium on the steep side and selling premium on the part that is already discounted. The spread costs almost the full width.
The 40 Delta Rule
The 40 delta strike is the consistent reference point for finding where skew flattens enough to put on a vertical at a reasonable price.
Delta measures roughly how likely an option is to finish in the money.
A 40 delta strike sits moderately out of the money and represents the area where premium has compressed enough to make a spread cost-efficient.
On the USO June expiration, the 40 delta sits at $138.
The 138/136 spread runs $1.00. The 137/135 spread runs $0.95.
Moving the entry closer to the money does not improve the pricing in any meaningful way.
The reason is mechanical. The curve does not actually flatten on the longer expirations of oil.
There is always 36 days of upside risk priced into the chain, and that premium does not compress until the duration shortens.
Why Shorter Duration Fixes The Problem
A weekly expiration on USO carries the same general curve shape compressed across less time.
The 42 delta strike on the end-of-week expiration sits at $140.
The $140/$139 spread on that expiration prices reasonably enough to make the trade work, against the same general directional thesis.
The shorter window cuts the geopolitical premium baked into the longer-dated trade.
You give up time for tradeable pricing, and the catalyst behind the print is short-dated anyway.
The China-Iran negotiation is the catalyst.
Trump landed in China with the major tech CEOs in tow this morning. The framing is leverage.
China is the largest single buyer of Iranian oil, and the United States is positioning to trade something concrete in exchange for pressure on Tehran.
The institutional position is reading a few-day window. The retail mirror should match that window.
How To Structure The Trade
The end-of-week put debit spread captures the move with skew working closer to neutral.
- Buy the USO May 16 $140 put
- Sell the USO May 16 $139 put
- Spread width: $1.00
- Cost: approximately $0.60 per spread
- Max risk: $0.60 per spread
- Direction: Bearish on a near-term China-Iran resolution narrative
- Catalyst: 10,000 contract bearish print on the June chain, Trump in China this week, pressure framing on Iran
- Skew edge: end-of-week expiration carries less upside risk premium than the June 18 chain
The sold leg at $139 reduces the cost of the bought leg at $140, which is why the spread costs $0.60 instead of the full price of the long put alone.
The most you can lose is what you pay to enter, and the most you can make is the $1.00 width of the spread.
The trigger is any sign that the Trump-China meetings are producing real progress on Iran.
A headline that names a concrete concession or a partial agreement pulls oil toward the $130 level the institutional position targeted.
The $140/$139 spread reaches $1.00 at expiration if USO trades through $139 with the move intact.
That is roughly a 67% return on the $0.60 entry.
What This Filter Catches
The Console runs the volume-to-open-interest math on every print and flags the institutional positions worth reading.
Reading the skew on top of that filter is the second step.
A flow service that only shows you the print would have left you mirroring the trade at $138/$136 and paying twice what the spread is worth.
The Console points at the position. The skew analysis tells you where on the chain to put your version of the trade.
See exactly how Block Hunter catches institutional positioning before the crowd catches on.
Brandon Chapman, CMT
Creator of Ghost Prints