
Hello Trader,
Have you ever noticed that many traders will make their entire year in just a few months or even weeks?
Heck, some folks make the entire decade in less than a year…
…and it’s the secret sauce to my long-term profitability.
Some people like to call it luck. Statisticians call it the “Fat Tail.”
And no one took it seriously until 1987 – October 19 to be specific.
Now, you’re probably familiar with or have heard of fat tails before.
But what I’m about to show you will change the way you look at the market forever.
Why the Bell Curve Lies to You
Most financial models lean on one comforting assumption – market returns follow a neat bell curve.
In that tidy fantasy, most days look about the same. Truly extreme moves are supposed to be almost impossible.
Real markets do not cooperate. They have fat tails.
Ignoring those tails is one of the fastest ways to get blindsided.
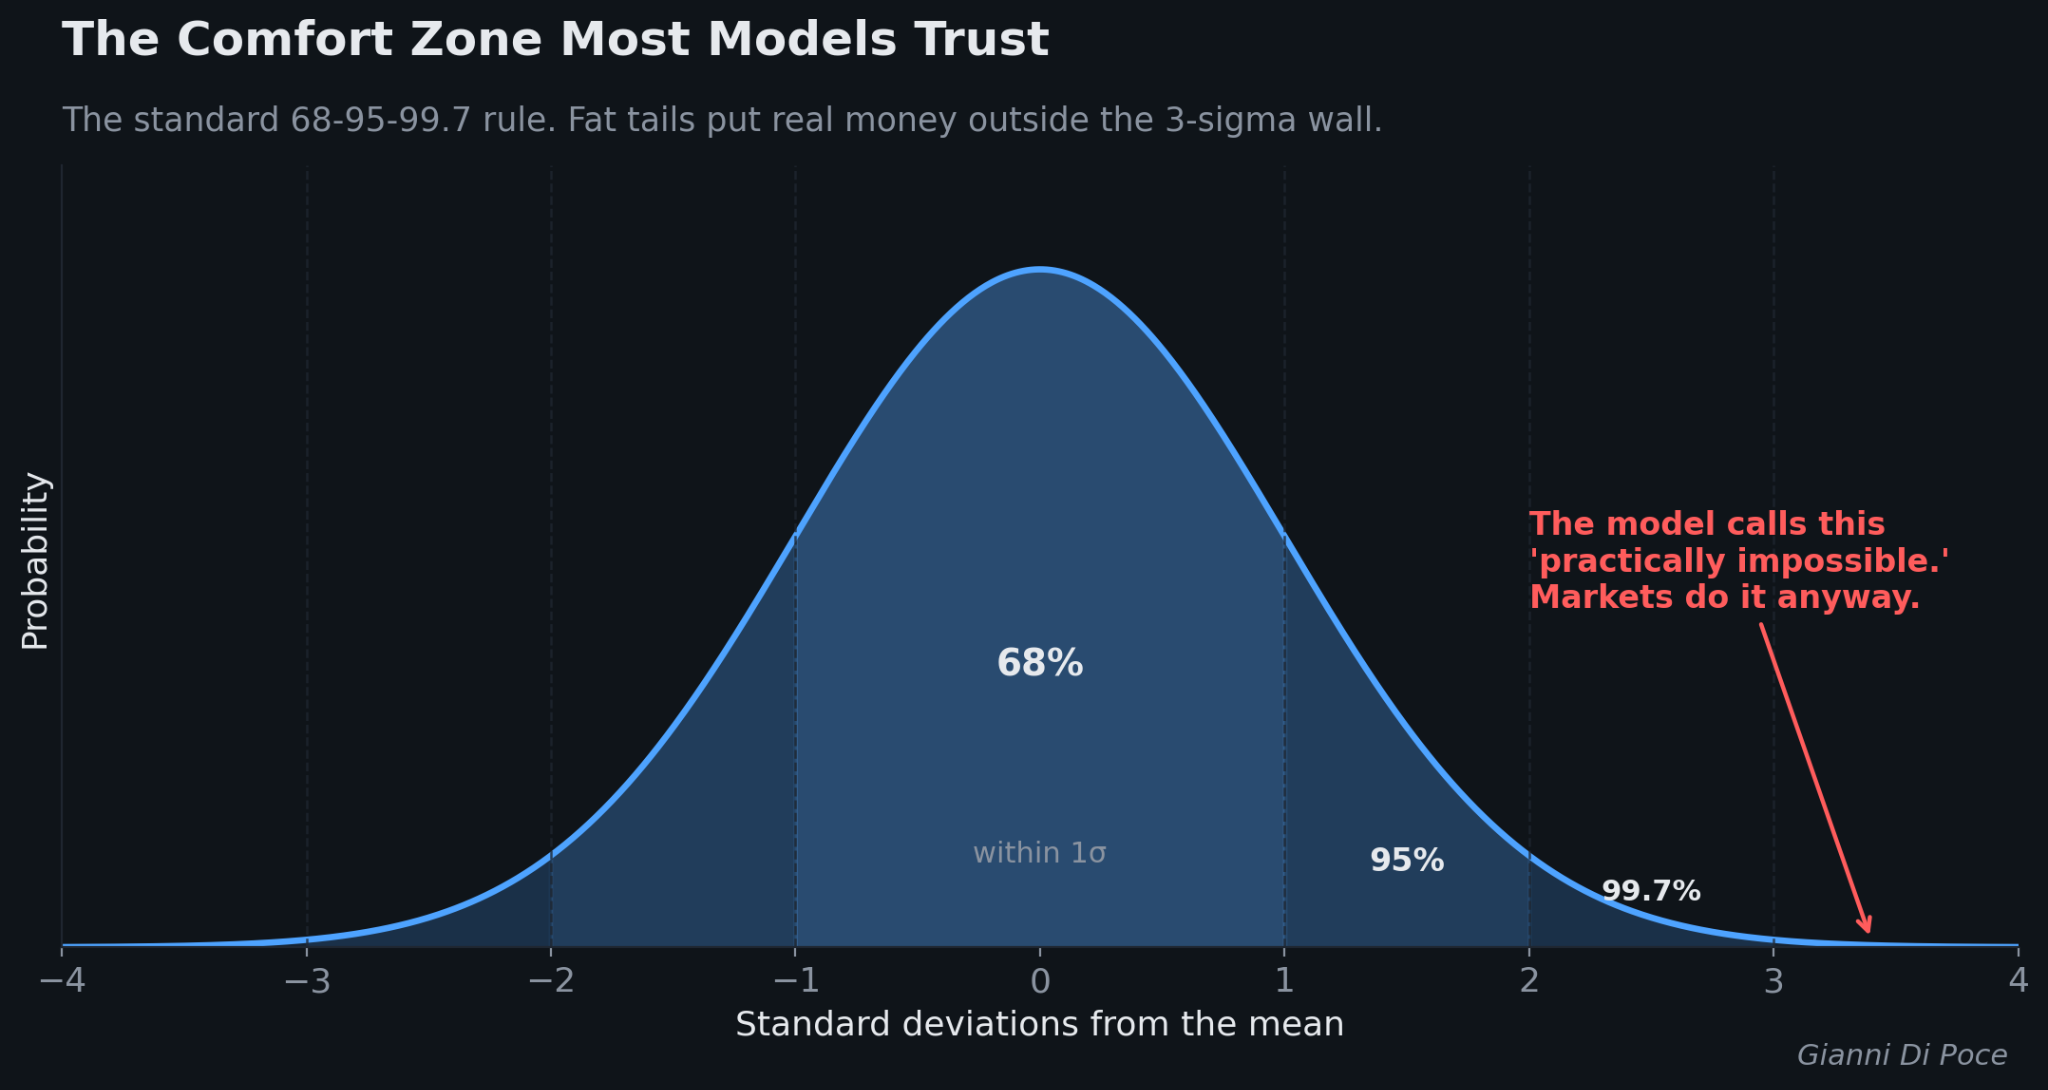
Start with the normal distribution, the classic bell curve. It has thin tails.
The further you move from the average, the faster the odds collapse.
Under that math, about 99.7% of outcomes land within three standard deviations of the mean. Anything past four or five deviations gets treated as practically impossible.
History keeps proving that wrong. The 1987 crash, the 2008 collapse, and the 2020 COVID plunge were all supposed to be nearly impossible.
Markets delivered all three inside a single generation.
What a Fat Tail Actually Is
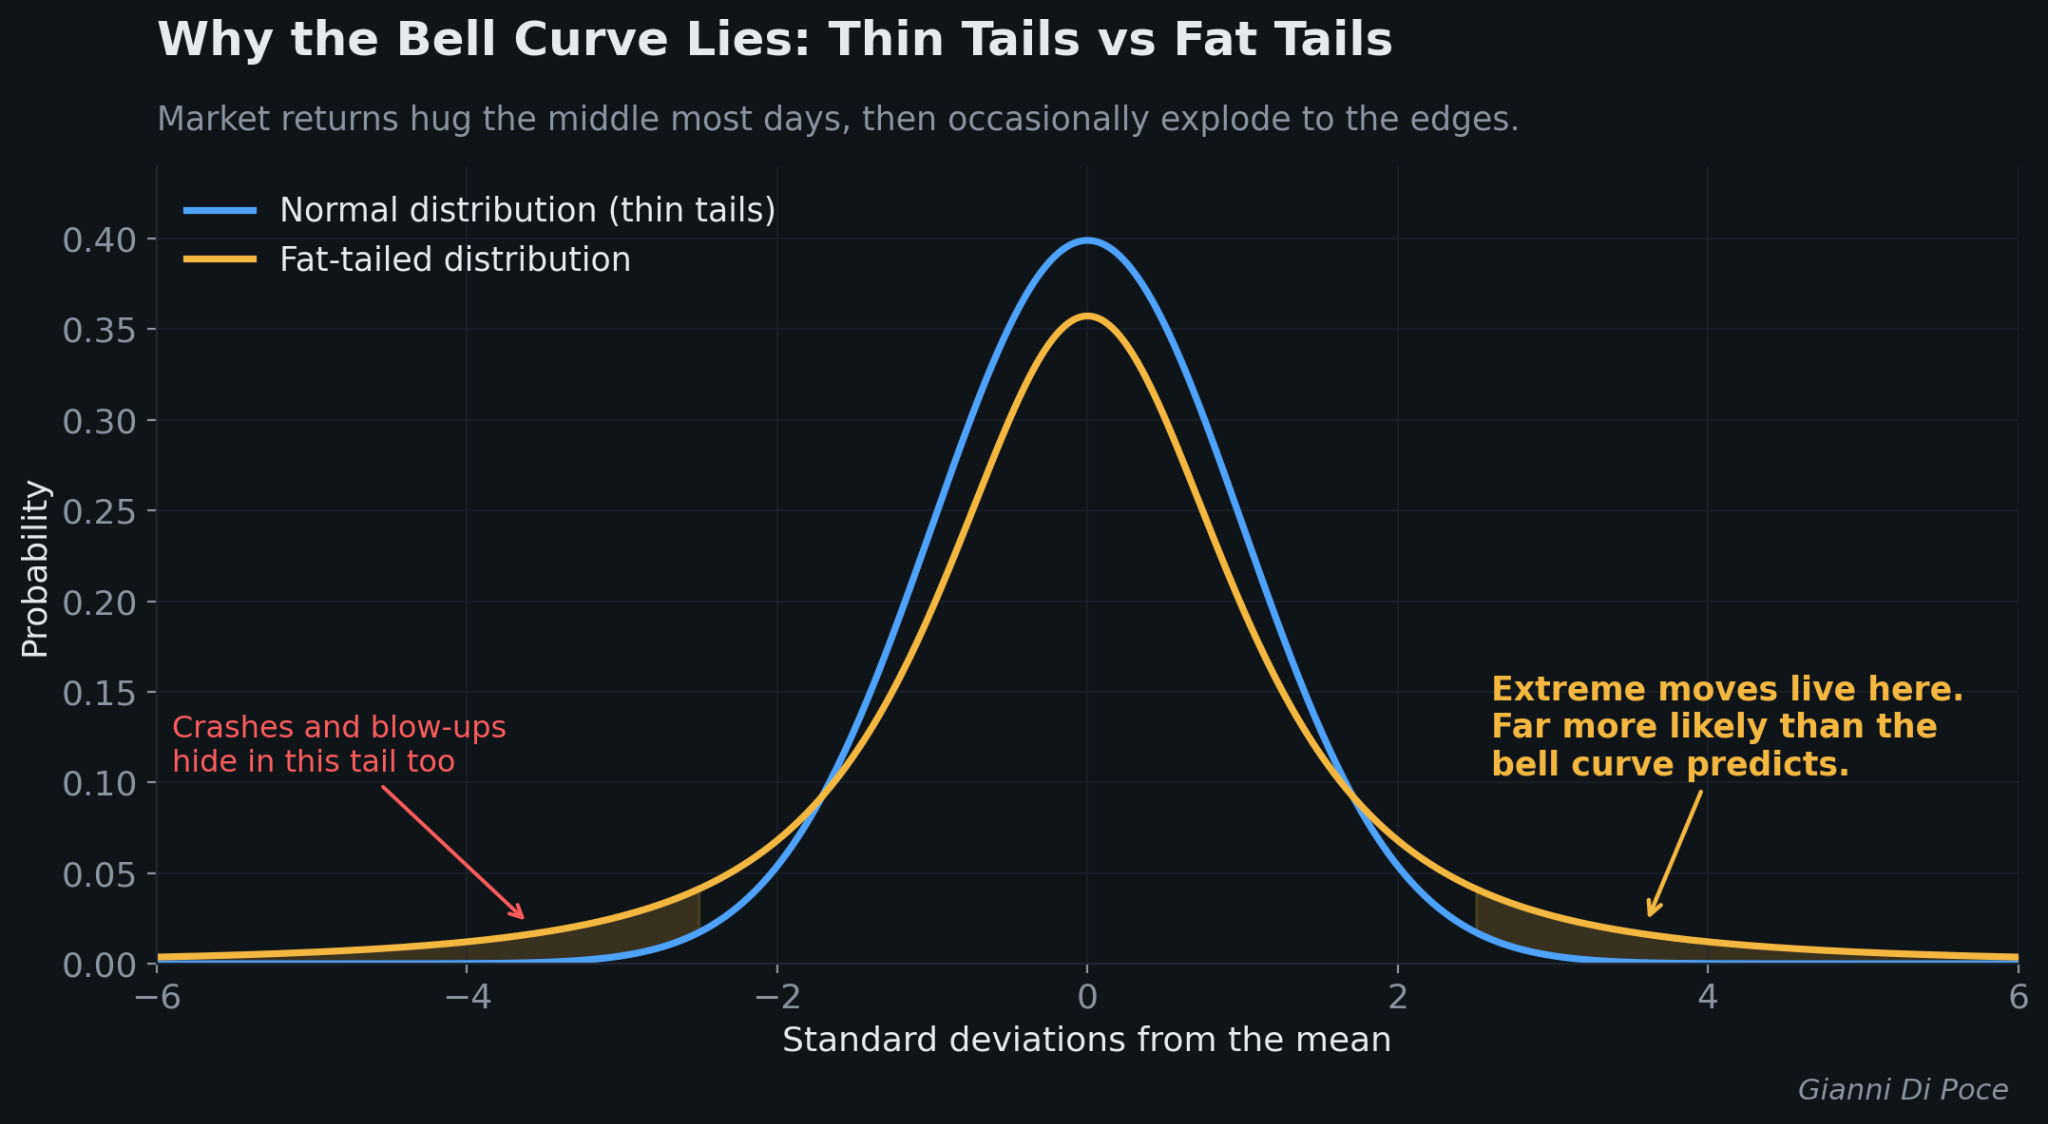
A fat-tailed distribution throws out that comfortable assumption. It carries higher kurtosis, which is just a fancy term for more weight sitting way out in the tails.
Extreme moves show up far more often than a bell curve predicts. That holds for monster winning streaks and account-ending blowups alike.
This is why your feed is full of screenshots of incredible green days. Nobody posts the accounts that got vaporized on the other side of that same distribution.
My recent run is a fat tail working in my favor. I caught one of those rare windows where a quarter of progress shows up in a couple of weeks.
It’s why I’ll keep taking shots on breakouts, breaking even, or gaining slightly. Because when I hit those runners, they tend to happen in bunches with large moves.
But, I never forget that the same shape cuts the other way. The tail that just paid me is the one that ends traders who never planned for it.
I build everything around surviving the bad tail while staying positioned for the good one. A few simple rules keep me in the game:
- Size positions so a single bad event can never end my career
- Build in redundancy and steer clear of excessive leverage
- Treat model outputs as helpful guides rather than gospel
That last rule earns its keep every year.
I argue with my own models constantly. Even when the Trinity Terminal flags a gorgeous setup, I respect that the market can do something no model saw coming.
Right or Paid
Here is the trade-off every serious trader eventually faces. You can fight to be right, or you can focus on making money.
Those two goals pull against each other more than people admit.
Positions matter more than opinions. Your P&L only reflects where you actually stood when the move arrived.
Survival comes down to endurance. You have to stomach the long, frustrating stretches so you are still standing when the fat tail finally shows up.
I have said this before. I will say it again.
I have made my entire year in a single quarter more times than I can count.
The other nine months get spent grinding sideways and protecting capital. That grind is the admission price for the move that actually matters.
That is all for now. If this cleared up how outliers really drive returns, reply and tell me about a trade where a fat tail caught you off guard.
I read every single response.
Have a great weekend,
Take Care,
Gianni Di Poce