Hey trader,
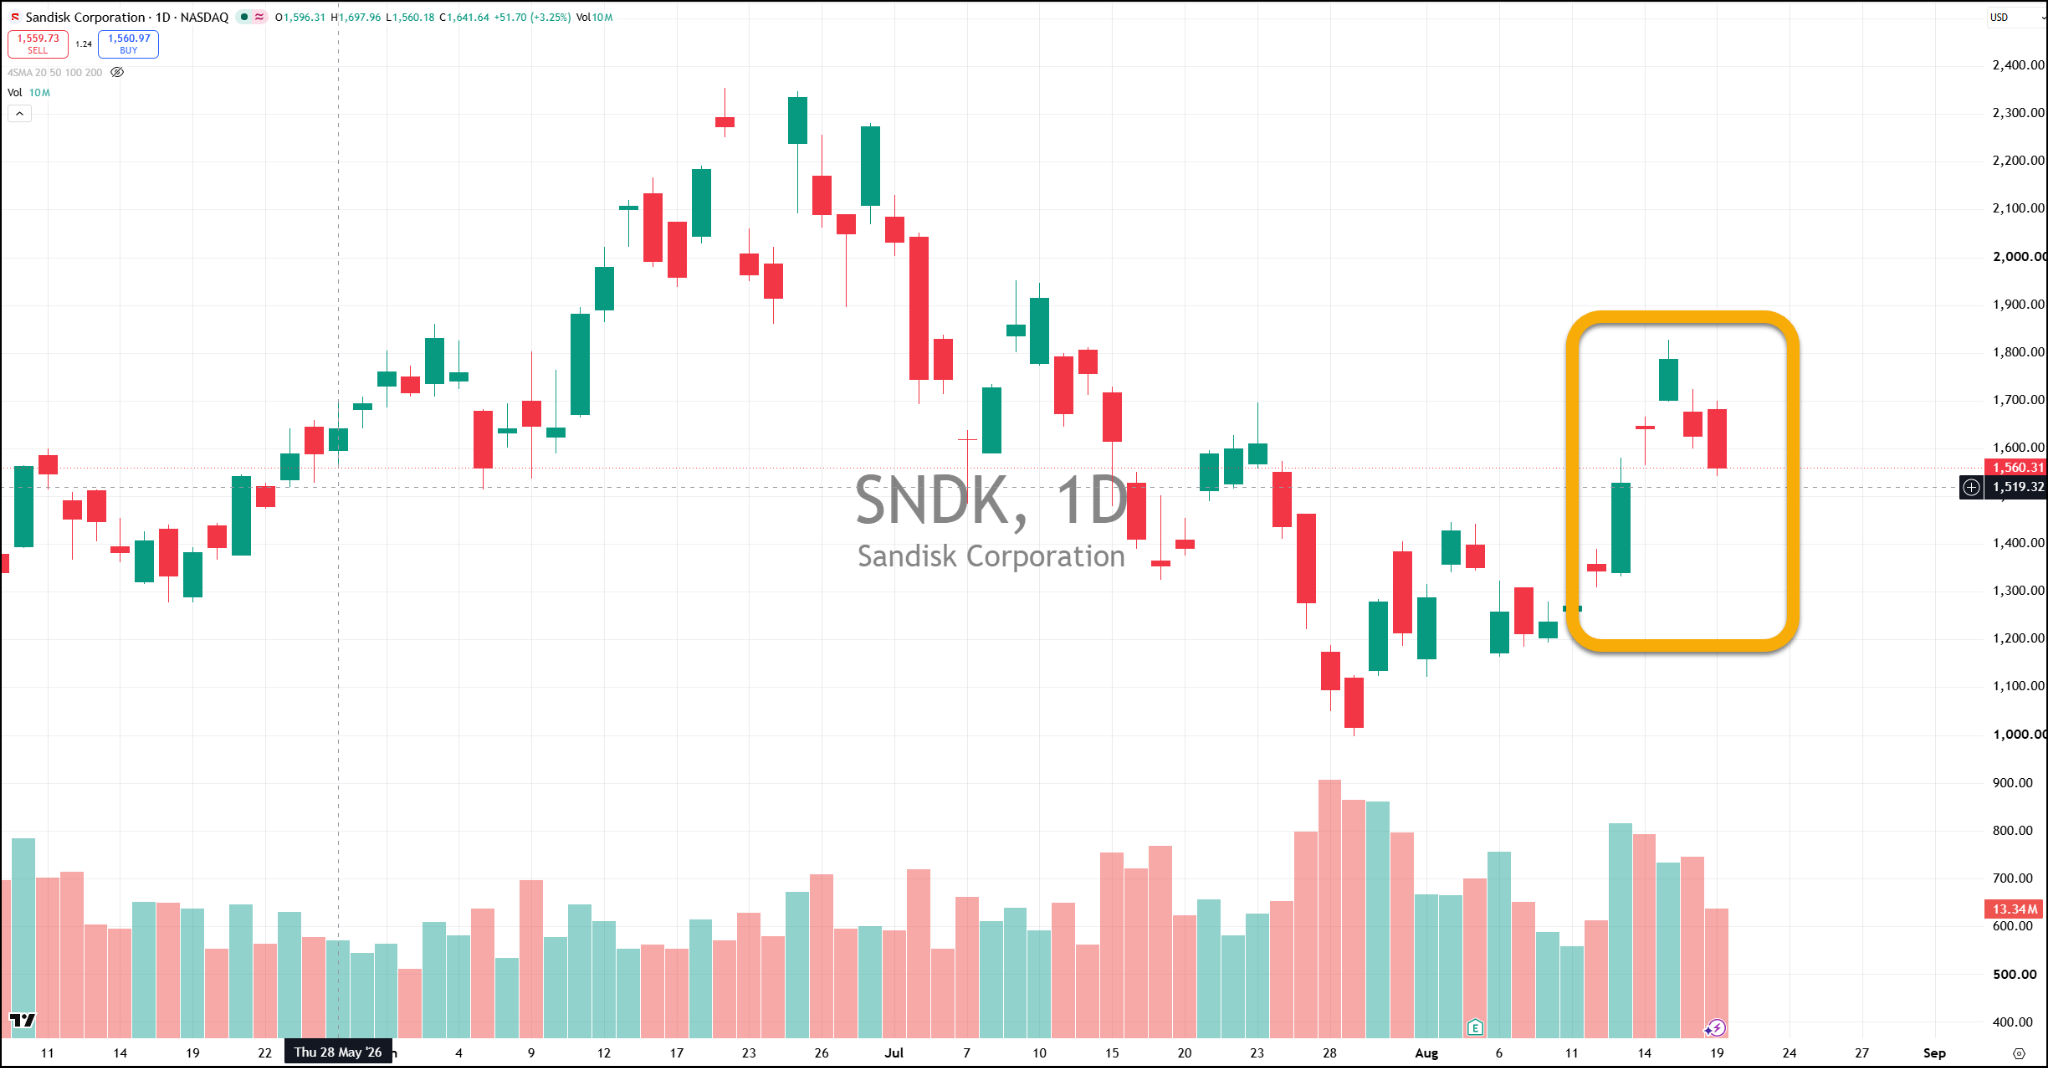
SanDisk jumped nearly 15% last Thursday.
By Monday, it was up almost 40%.
Today, it’s down almost 15% from the highs.
It’s like no one can decide whether they want to own or sell the stock.
Actually, that’s pretty much what’s happening.
Stock correlation, the tendency for different stocks to all move together, has collapsed to its lowest level in market history.
You see it everywhere these days. Healthcare climbs while semiconductors fall. Staples jump while energy drops.
It creates some pretty epic moves, but also presents serious risk.
We have an environment ripe for what I call a liquidity trap, where a stock doesn’t just fall…it takes a swan dive.
I want to take you through this concept so you understand the risks that lie before us.
Because I promise you, this market isn’t like anything you’ve ever seen before
What The Liquidity Trap Actually Is
Correlation is the glue that holds a market together. That glue has come apart.
I am looking at ultra low correlation across stocks. It sits at the most extreme reading in the history of the market.
When stocks correlate, money arrives as index flow. That flow drives price, stays with it, and protects it.
This tape moves money out of one sector without moving it into the next one in step. The bid underneath vanishes during the handoff.
I call the result a gamma liquidity pocket. Stocks drop out of the sky through those pockets.
Why This Market Built The Trap
The mechanism has a name on institutional desks. Traders run the dispersion trade, and correlation models run everything else.
Dispersion breaks correlation on purpose. Some stocks go parabolic for no sensible reason. Some fall 10% in five minutes for no sensible reason.
Low correlation exposes you to massive gamma risk. The lack of correlation itself manufactures the illiquidity.
The damage shows up in three places I check every session:
- Sector pairs that split apart, with tech up while staples are down.
- Single names trading with no pricing mechanism at all.
- Index level air pockets that open with no warning attached.
What It Looks Like On The Chart
You walk in and see a stock down 2%. You blink, and it’s down 8%-9%.
The index version runs worse.
The Goldman Sachs decks tell me the S&P 500 opens down 1%, the dip buyers step in, and the correlation break drags it down two, three, or four percent.
They stop trading and put the breakers on. You look up with no idea what hit you.
I expect the S&P 500 to potentially fall four to five percent on any given day. This structure has already produced that move.
SanDisk Puts A Number On The Problem
I wake up every single day and see SanDisk down 200. That figure is not a misprint.
Any day I walk in, it is up 200 or it is down 400. There is no pricing mechanism left in that stock.
If you are trading SanDisk, you need therapy. I mean that with affection and complete seriousness.
My mentor Frank Walsh calls a product like this a chocolate covered hand grenade. It looks beautiful and shiny on the outside. It blows you up from within.
How You Limit The Damage Tomorrow
Size is your first control. Traders carry an 80% success rate and still lose money because their size is too large.
Defined risk is your second control. A spread, a calendar, or an iron condor contains the damage by design.
Your third control is an automatic exit set before the pocket opens. I prefer a trailing stop where an algo takes me out, because I am the type who will delay and never pull the trigger.
Three habits keep me out of these air pockets:
- I scrub every position at 3:00 a.m. for risk, breakpoints, and losses.
- I hold low beta dividend payers, which are the names responding positively right now.
- I buy a put and protect a position rather than sell into a squeeze.
Neglect turns a liquidity pocket into a permanent loss. You stop watching the quiet position, and the pocket finds it first.
Money and flow tell you the story. Hope has no place in this tape.
Correlation will not repair itself on your schedule. You need to see the break while it is happening, not after your account absorbs it.
A liquidity pocket opens in the space where the machines stop agreeing with each other. You will not find that disagreement in a headline, because the move finishes before the news explains it.
I spent 15 years close enough to those machines to read the one piece of logic every one of them runs on. That reading is the entire foundation of the Genesis COG System.
The Genesis COG System hands you the complete methodology, including the Footprint Finder that checks every phase across hundreds of stocks all day long.
I am holding this founding group to 50 traders so I can actually know who is on the other end. The door shuts when the fiftieth seat fills.
Professor Jeffrey Bierman
Creator of the Genesis COG System