Hey Trader,
A stock breaks support and closes red. Your screen calls that a sell – a real breakdown.
So you get short.
That trade costs you twice. You hand your shares to the buyer at the low, then you pay him again on the squeeze.
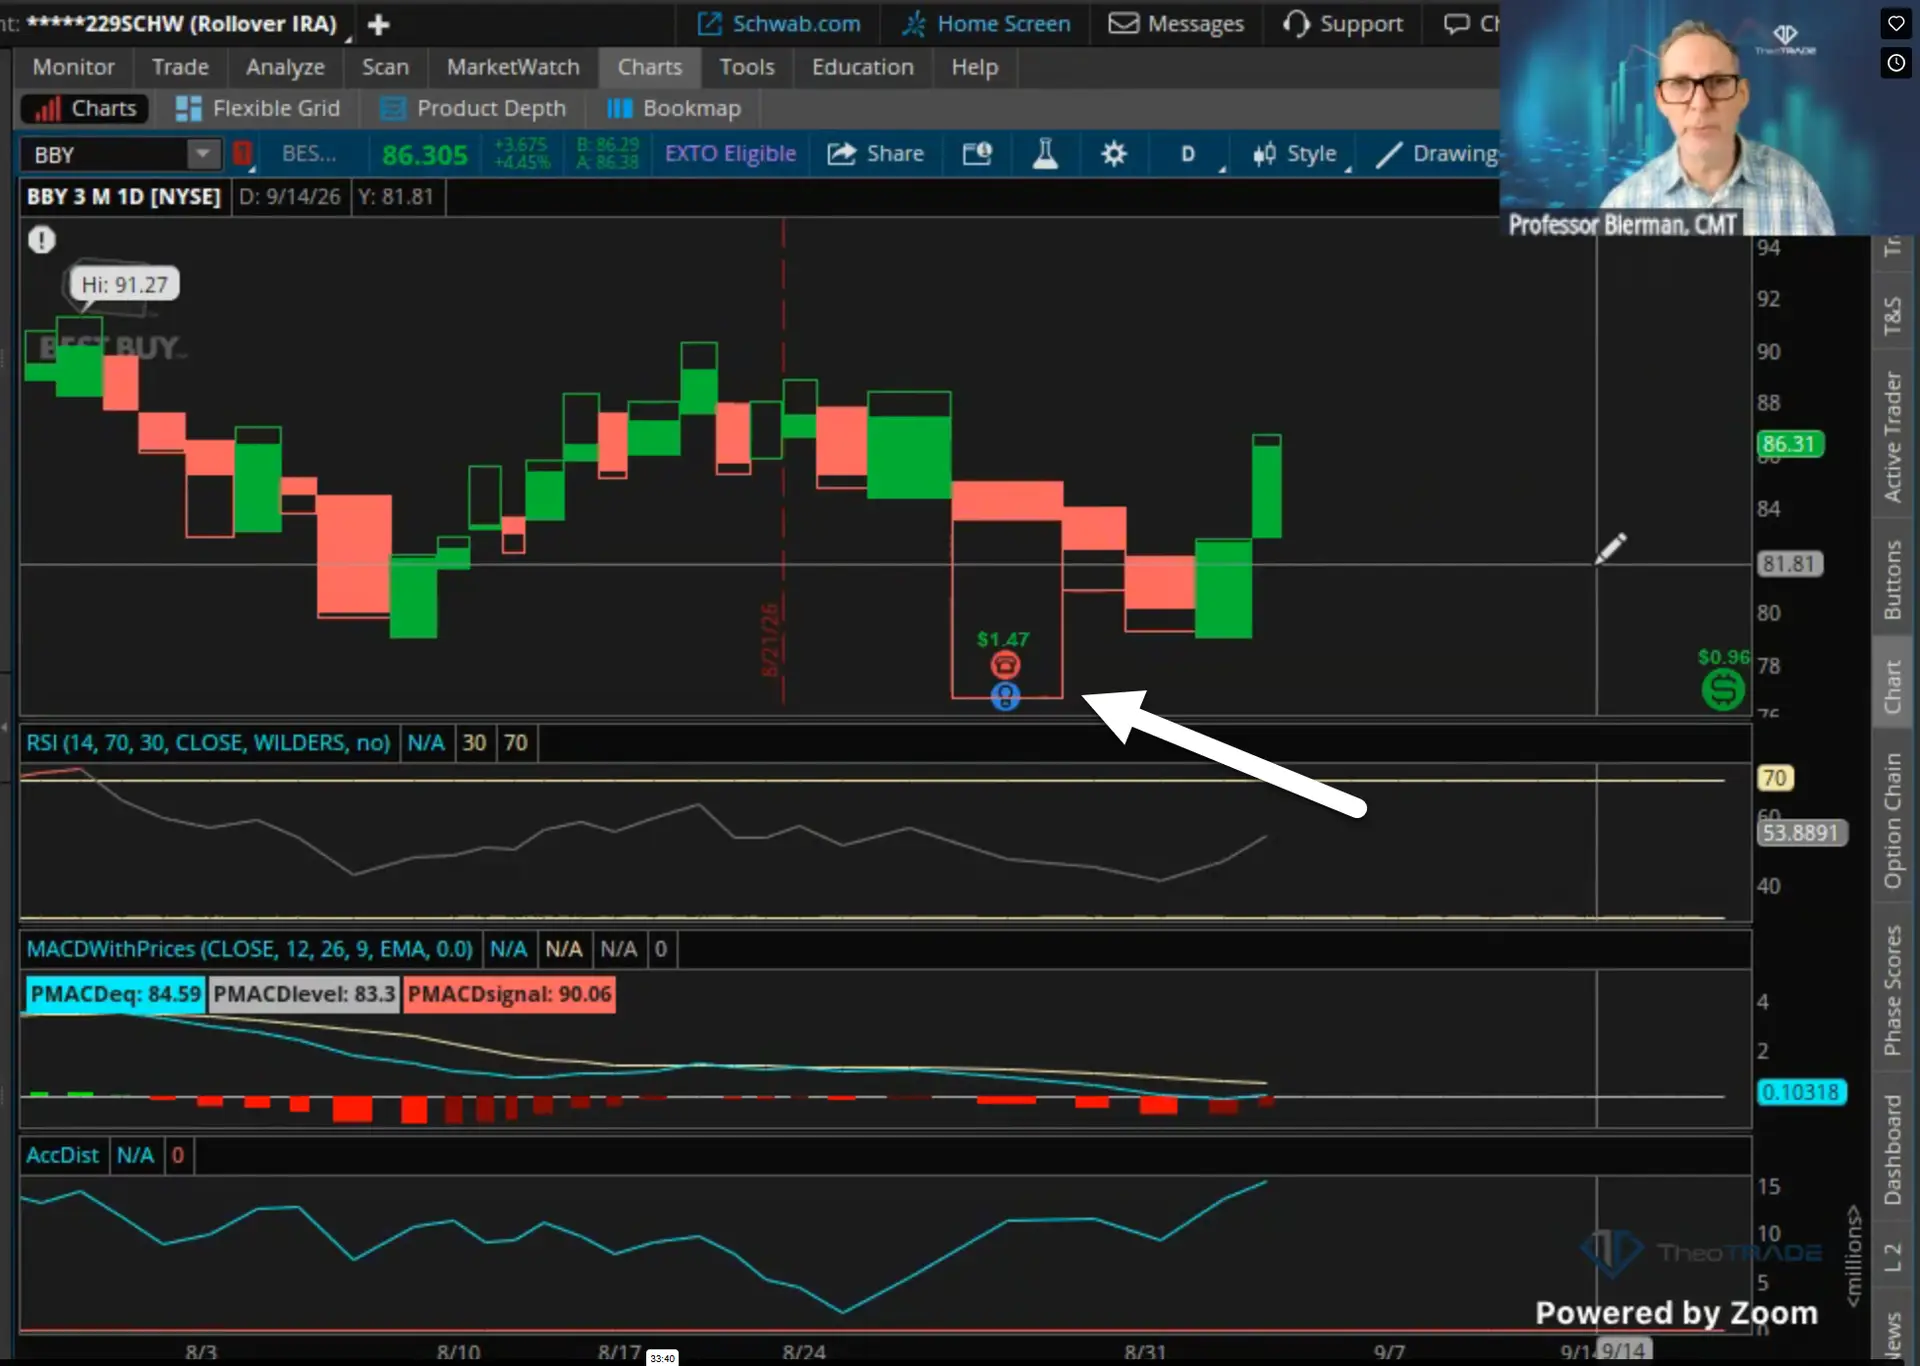
Best Buy did this to people after earnings. It cracked support, traded down to 76.70, and closed back up near resistance.
The shorts got three bucks out of it, from 82 down to 79. Then it turned and ran to 90 in about a week.
I missed that trade. I flat out missed it, and the chart was telling me to load the boat.
Today I want to show you the one reading that separated the sell from the buy.
It came out of an Equivolume box, not a candlestick.
Nine million shares traded that session against a three million average. Wide boxes on a reversal mean capitulation, and capitulation pays.
Here’s how to read them.
The Chart That Puts Volume Inside the Price
Equivolume merges price and volume into a single box for every period. Richard Arms built it.
These boxes carry no wicks. The top is the high of the day and the bottom is the low.
The width of the box gives you the volume. The height gives you the price volatility.
A horizontal line inside the box marks the close. I laid out the full anatomy of that box on Monday, and you can read that breakdown here.
Adding it takes one click. Go to Style on your platform, select Equivolume, and your candles convert automatically.
I am not telling you to abandon candlesticks. My brain reads candles better because I have 108 combinations memorized as a CMT.
Equivolume earns its space on one job. I bring it up to see whether a massive breakout or a massive breakdown actually happened.
How You Read the Width
I pull up an Equivolume chart hunting for one thing. I want extraordinary width.
A thin box tells me participation walked out. A box that dwarfs everything around it tells me institutions traded that day.
Then I ask the only question that matters. I need to know whether that heavy volume came on a breakdown or on a reversal.
Heavy volume on a breakdown confirms the selling. Heavy volume on a reversal marks a capitulation washout, and washouts pay.
The close settles which one you have. Corey Rosenbloom will tell you the close matters far more than the open, and Gianni Di Poce says the same thing every day.
Here is the flaw nobody warns you about. The platform cannot aggregate the volume number inside the box.
You see a wide box on your screen. You do not see the share count behind it.
So put the volume subgraph back underneath and quantify it. Three readings turn that box into a decision:
- Twice the average daily volume means something real happened
- Three times the average means institutions did it
- A close near the top of a wide red box means they bought your panic
How That Read Played Best Buy
Best Buy reported and beat the estimate by 90 cents. The stock still broke below support.
It traded down to 76.70 and closed back near resistance. The average trader saw broken support and got short at 82.
That short paid three bucks down to 79. Then it quit paying.
The stock reversed off 79 and ran to 90 inside a week. Anyone still short three days later got squeezed to death.
Now run the width read on that same session. Volume came in near nine million shares against a three million average.
That was the widest Equivolume box on the chart in six months. Three times average volume on a reversal day gives you a buy.
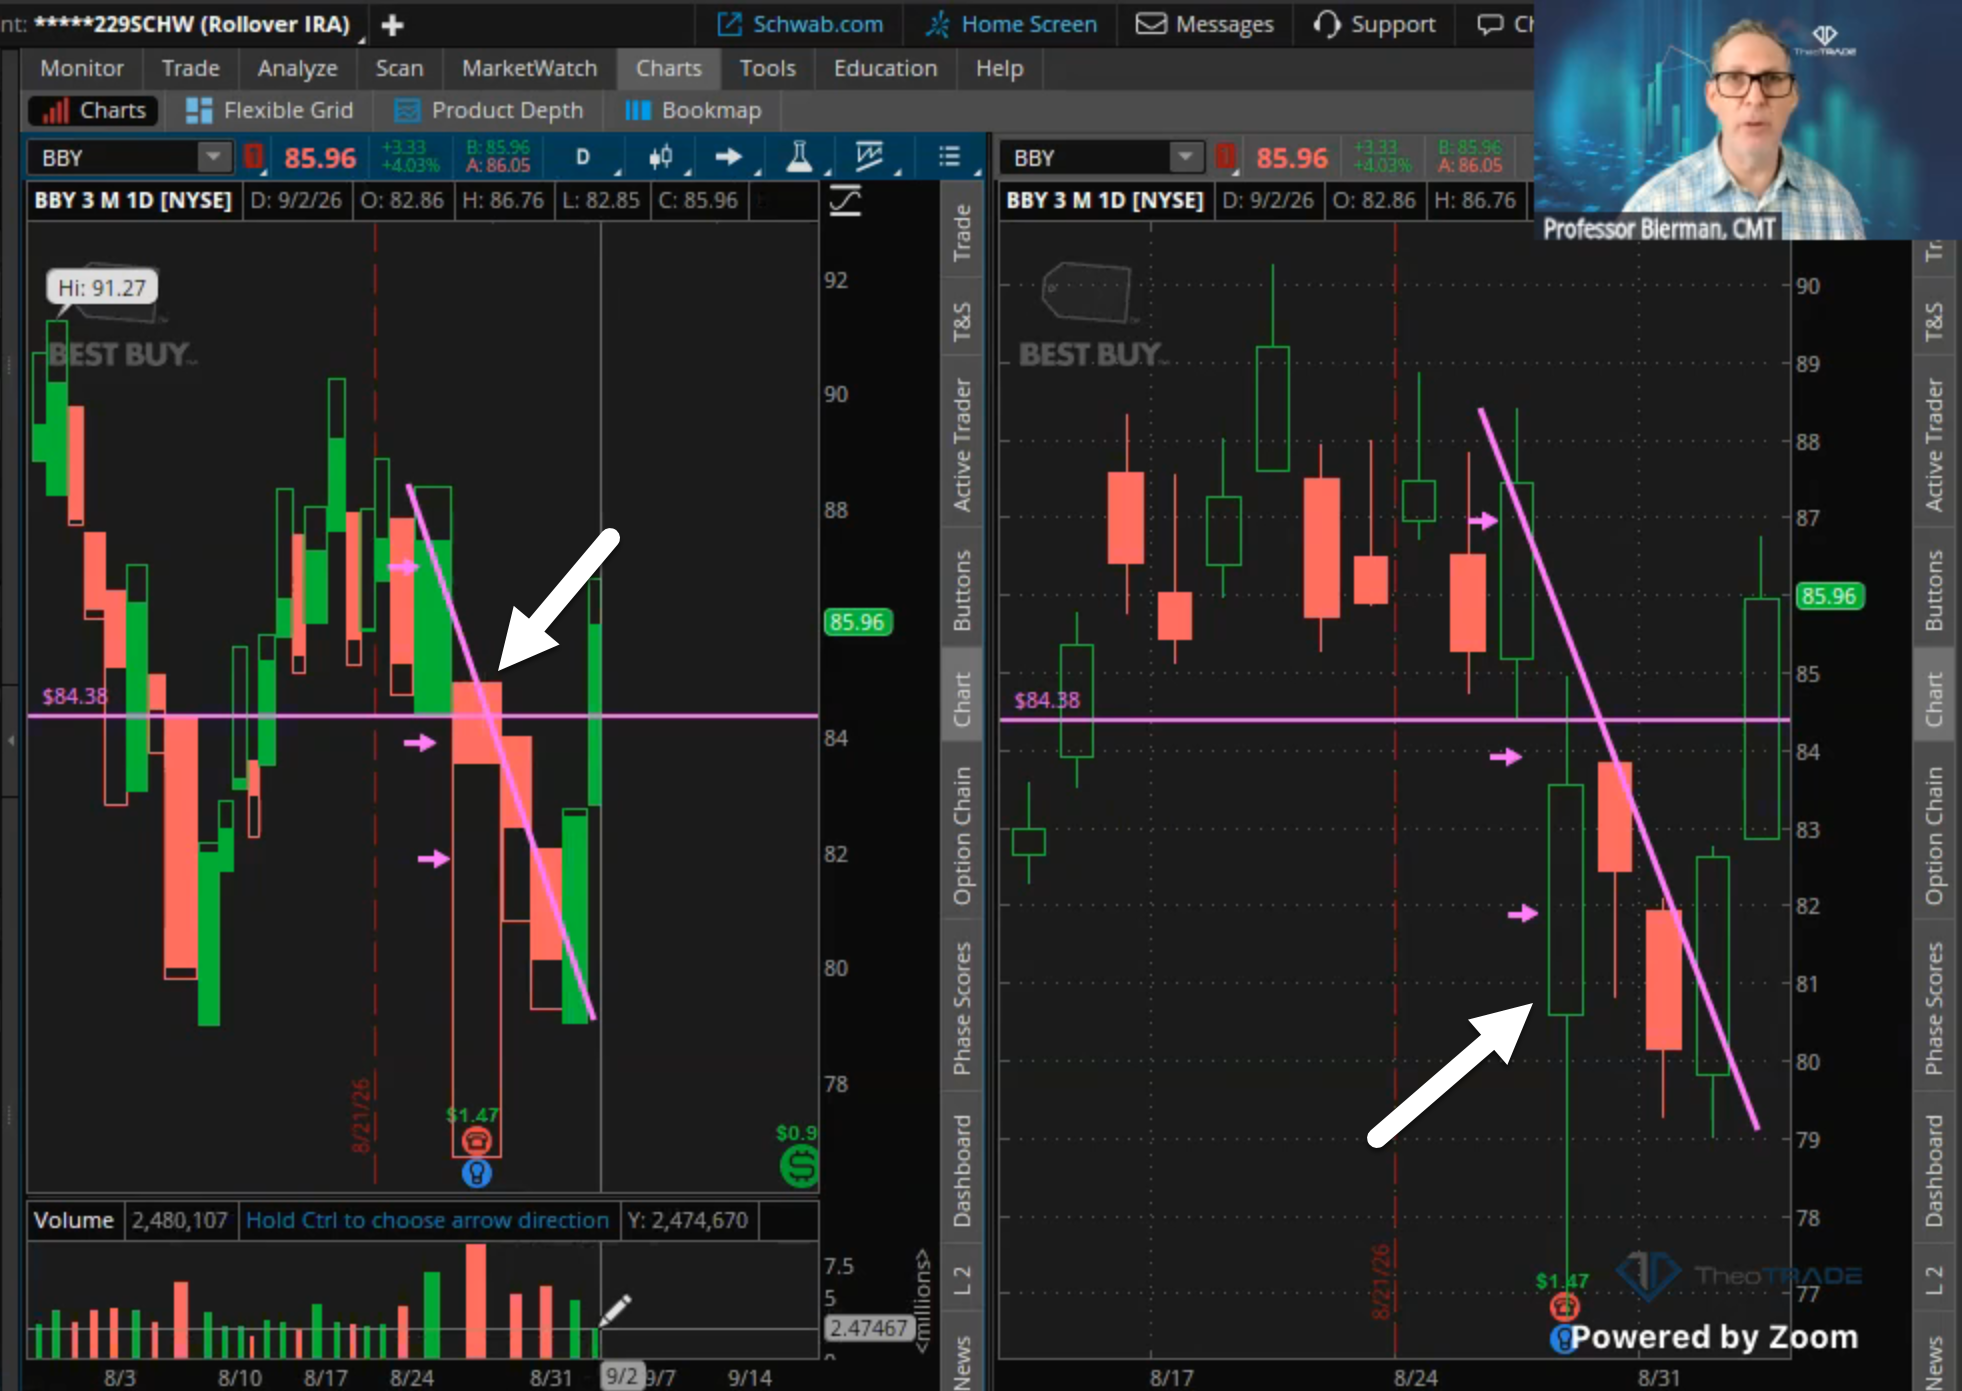
Compare it to the August 6th breakdown on the same name. Volume there ran 5.6 million against a 2.5 to 3 million average.
Twice average told you the breakdown was real. Three times average told you the reversal was real.
The fundamentals closed the case. The multiple compressed to about eight times earnings while the earnings expanded, so smart money stepped in at 79.
I missed it. I flat out missed it.
Give me a breakout or a breakdown and I am hard to touch. Buying reversals has never been my game.
Corey Rosenbloom, Gianni Di Poce, and Blake Young all read them better than I do. I told myself to hold off and I watched the whole run go without me.
How You Trade This Tomorrow
Start with the close and work backward. Pull the names that broke support and closed back near the top of their range.
Then measure the width against the average. Two times average is interesting. Three times average is institutional.
Then check the multiple against the direction of the earnings. A compressed multiple with expanding earnings gives that reversal a reason to hold.
Charts alone will not save you here. Fundamentals turn a wide red box into a trade you can size.
One rule keeps you out of the ugly version of this. Never buy ahead of an earnings report, no matter what the box looks like.
Reading one box is a skill you can learn this week. Reading a few hundred of them before the close is a different job entirely.
The Genesis COG System hands you the full methodology. You get the width rules, the volume confirmation, and the fundamental overlay that told you Best Buy was free money at eight times earnings.
I am teaching Equivolume inside it every day this week. Enrollment is open right now.
👉 Enroll in the Genesis COG System
Professor Jeffrey Bierman
Creator of the Genesis COG System