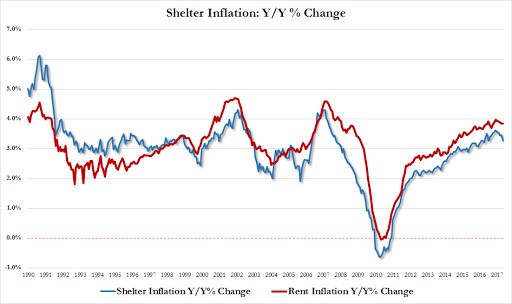
Besides oil pressuring inflation, it looks like shelter inflation is also starting to decline. As you can see from the chart below, both shelter inflation and rent inflation are coming down. This is logical because apartment real estate prices are starting to come down as it appears there were too many apartment buildings built. The rent costs as a percentage of GDP reached a record high, so it will be nice for the middle class to get a relief on this front as long as wage growth is stable. Currently wage growth is 3.5%, so it’s very close to the growth rates seen below. While this is great news for the consumer, the Fed wants inflation to reach 2% so if this chart rolls over, it will be very tough to get to 2%.
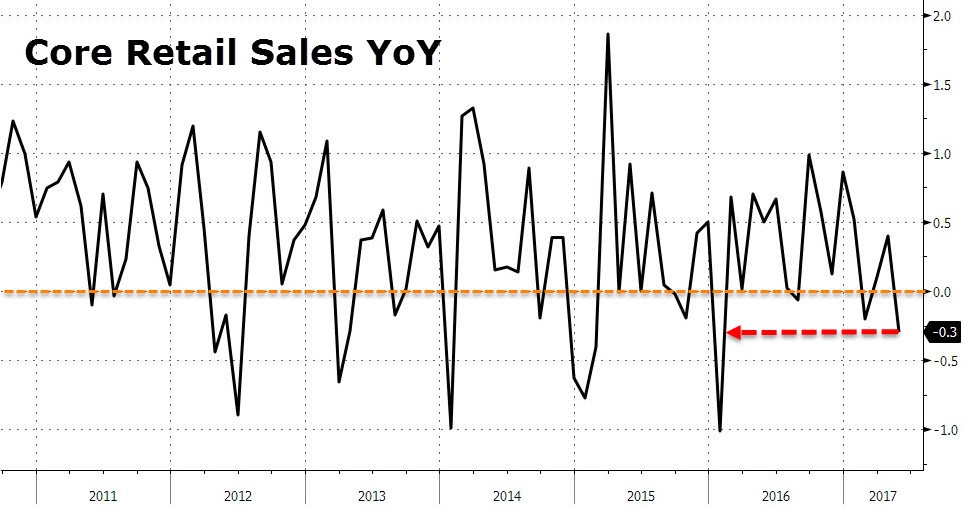
The Fed claims the economy so strong, it can handle rate hikes despite the low inflation rate. Pouring cold water on that thesis, retail sales were disappointing. Retail sales fell 0.3% month over month which is the worst report since January 2016. The chart below shows core retail sales also fell 0.3%. As you can see, the last few negative reports have come in the winter because of weather effects. The last decline of this size outside of the winter was in 2013. Auto sales declined 0.2% which was deceleration from 0.5% growth in April. The weakest category was electronics stores which saw a 2.8% decline. This decline could be bad for Apple and Microsoft although the sales may have switched to online. We’ll get the details when those firms report in July. This is also bad for BestBuy which had an enormous 21.48% short squeeze rally last month even though it barely showed any sales growth.
With the Fed’s hawkish rate hike, it has pushed the difference between the 10-year yield and the 2-year yield to 79 basis points as you can see from the chart below. The more hawkish the Fed gets, the quicker the next recession will come, barring tax cuts being enacted. I have said the stock market will correct if the yield curve breaks below the flattest point in 2016. There has been no response from stocks so far, but I still expect this key technical point to trigger selling. The bond market is screaming that the economic cycle is ending. It’s important for investors to heed this warning. I trust the bond market much more than the Fed’s economic forecasts.

The bond market seems to be ignoring the effect the Fed’s balance sheet unwind will have on the supply and demand of treasuries and mortgage back securities. Instead the market is viewing the unwind as another hike in interest rates. BMO says the $325 billion of treasuries unwound in 2018 is the equivalent of a half of a 25 basis point rate hike.
Getting into the specifics of the Fed’s unwind plan. The Fed said it would start the unwind caps at $6 billion per month in treasuries and $4 billion per month in mortgage backed securities. It’s going to raise the caps every 3 months for 12 months until it reaches $30 billion per month in treasuries and $20 billion per month in mortgage backed securities. Goldman Sachs expects this plan to terminate in mid-2020. I find this plan wishful thinking because there’s no way the economy will avoid a recession by 2020 with the yield curve looking like it will invert after the Fed raises rates for the third time in 2017 in December.
None of the details of the unwind surprised me because the Fed gave much of the specifics in the Minutes last month. The numbers thrown around by Goldman Sachs were close to what was decided. The biggest place where Goldman Sachs was wrong was the timing of its start. Just a few months ago, Goldman Sachs said the Fed would start the unwind in the middle of 2018. Now it looks like the Fed will start the unwind in September, raise rates in December, and pause further rate hikes for the first half of 2018 as it boosts the unwind schedule gingerly. I find it convenient that the $50 billion per month of balance sheet reductions is almost the same size as the $60 billion per month in bond buying by the ECB. It’s almost as if the Fed and the ECB coordinated their policies. The ECB extended its bong buying and the Fed said it would start its unwind at the same time.
I’ve been focused on mid-2018 period because that’s when the collective central bank’s balance sheets were expected to start shrinking in total. This was an estimate. If the ECB continues its buying, that point may be delayed. It’s important to note that the ECB seems to be fine with not unwinding the balance sheet. Officials have said if it maintains its size it will shrink in relation to the economy as GDP grows. Out of the JCB, ECB, and the Fed, the ECB is the only central bank which did a mini unwind since the financial crisis. It looks like the ECB doesn’t want to repeat that strategy. I expect the Fed to quickly reverse the balance sheet reduction after the economy goes into a recession at some point in 2018 or 2019.
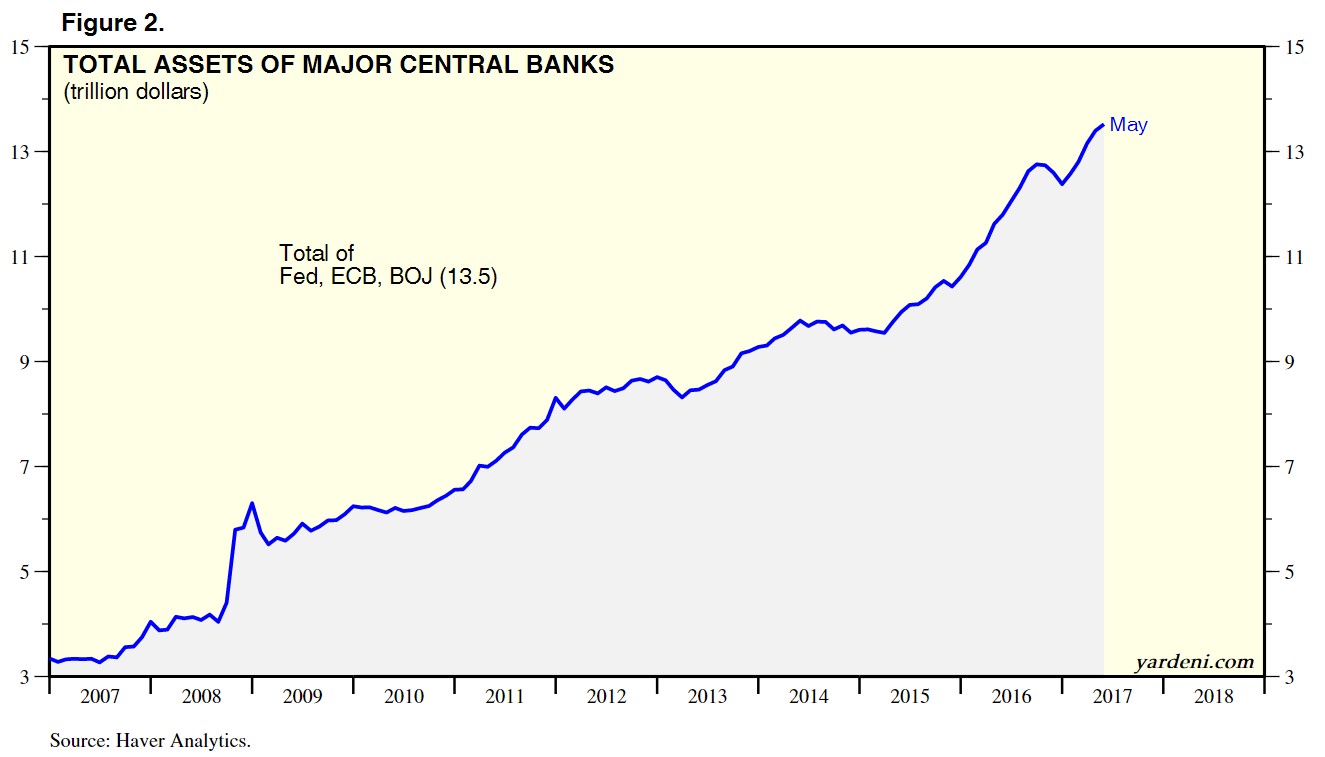
With the ECB maintaining its purchases of bonds, I expect the trend in central banks’ assets growing, seen in the chart below, to continue. That’s the ultimate measure of whether risk assets can continue to march higher. Even if the Fed goes through with its unwind until 2020, the only that matters is what the collective size of the central banks’ balance sheets is. This isn’t a real economic recovery until this chart falls. The question shouldn’t be when it will fall because that probably won’t happen. The real question is when the central banks will run out of assets to purchase. That would be the end of this new world order.
Recent Comments