I stepped into a position the this morning that most traders would not go near with a ten-foot pole.
That was the point.
The stock is Alibaba, and right now it is about as hated as a chart gets. This week Anthropic, the artificial intelligence company, sent a letter to the White House and to U.S. senators accusing Alibaba of running a massive effort to illicitly copy its Claude models, tens of millions of exchanges harvested through thousands of fake accounts.
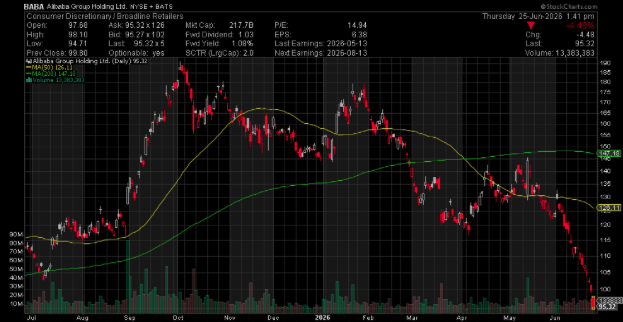
The stock, already beaten down, did what stocks do when that kind of headline lands. It got sold. Alibaba is down roughly 26% in a month and 38% on the year.
So why on earth would I want it?
Because when I pulled up the chart, the sell-side activity was so horrendous that I actually got a little excited. I do not often see one this washed out.
Let me explain why a chart nobody loves is sometimes exactly the one I want.
Every stock has an expected move, the range the options market prices it to trade within. Most of the time price wanders around inside that range and meets at the happy place in the middle.
But every so often a name does not just slip to the lower edge of its expected move. It tags that edge over and over, closing outside it day after day. With Alibaba, I am not sure I have ever seen that many closes outside the edge.
Nobody wants this thing.
That is not normal weakness. That is capitulation, the sound of the last seller giving up. Everyone who was going to panic over that headline has already panicked.
The float has changed hands from weak holders to whoever is willing to step in, and there is very little supply left to push it lower.
That is the setup for what I call a rip-your-face-off rally.
Not because the company suddenly got good, and not because I have a take on whether the accusation is true. Because the stock got so oversold that the slightest bid can send it snapping back, the way a rubber band stretched too far recoils hard the moment you stop pulling. I think this one comes right back toward the 100 handle when it bounces.
Now the discipline part, because this is where people blow themselves up. Oversold is not a buy signal by itself.
A stock can stay hated longer than you can stay solvent. So I gave myself 22 days, longer than I would normally want, because I am looking for a short-term bounce and I do not want to crowd the expiration if the timing runs late.
The risk I actually worry about is not that I am wrong about the bounce. It is that the bounce comes too late.
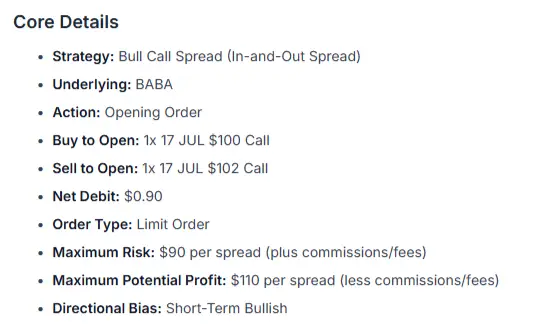
Alibaba bleeds down toward, say, 85 first, and then the rip-your-face-off rally only carries it back to 95. The move I am right about still does not travel far enough to pay.
That is the real danger in buying the hated chart, and it is why time and a defined target matter more here than anywhere else.
This is the opposite of how most people trade. They want the chart that is already climbing the right corner of the screen.
I get interested when a name has been left for dead, when the expected move says the selling has gone too far, when nobody else will put their hand out. The crowded winner is priced for perfection. The hated loser is priced for a funeral that may not happen.
You do not take this trade often, and you do not take it on hope.
You take it when the chart has done something it almost never does, with time on your side and a level in mind.
To your success,
Don Kaufman
P.S. If you want to follow trades like the BABA one, see them in real-time, along with how I put these ideas together, check this out.