Best Rally Since 1931 Ends
The stock market just had its best 3 day span since 1931. Gains were enormous off the low on Monday. It’s no surprise that stocks took a breather on Friday. Even if you’re a bull, you had to expect that to happen. Many were hoping for a down day with little major shifts. We almost got that, but there was a sharp decline at the end of the day.
Relatively speaking, this was a calm day compared to the rest of the month though. Specifically, the S&P 500 fell 3.37%. It started to rally towards the flat line in the afternoon, but then it fell 2.74% from 3:30 to 3:55. It was as if investors knew stocks were way too overbought in the near term, so they made sure the market couldn’t go positive.
Personally, I see a lot of negative sentiment among investors as they think the market needs to test the low on Monday. It's not guaranteed to fall like many others say. Ultimately, it comes down to the news flow. If sentiment pushes towards expecting an end to the shutdown in the next month because cases peak in America, stocks will reach new highs within a couple weeks.
If sentiment leans towards expecting a reopening in June, the market might be caught in ‘no man’s land’ where it can go either way. And, if the market prices in an elongated shutdown, it will drift lower over the next few weeks. Now it likely won’t be a violent fall, but the total decline will be 40% or more. Currently, we are only 25% off the peak, so it would be a nasty fall in terms of losses.
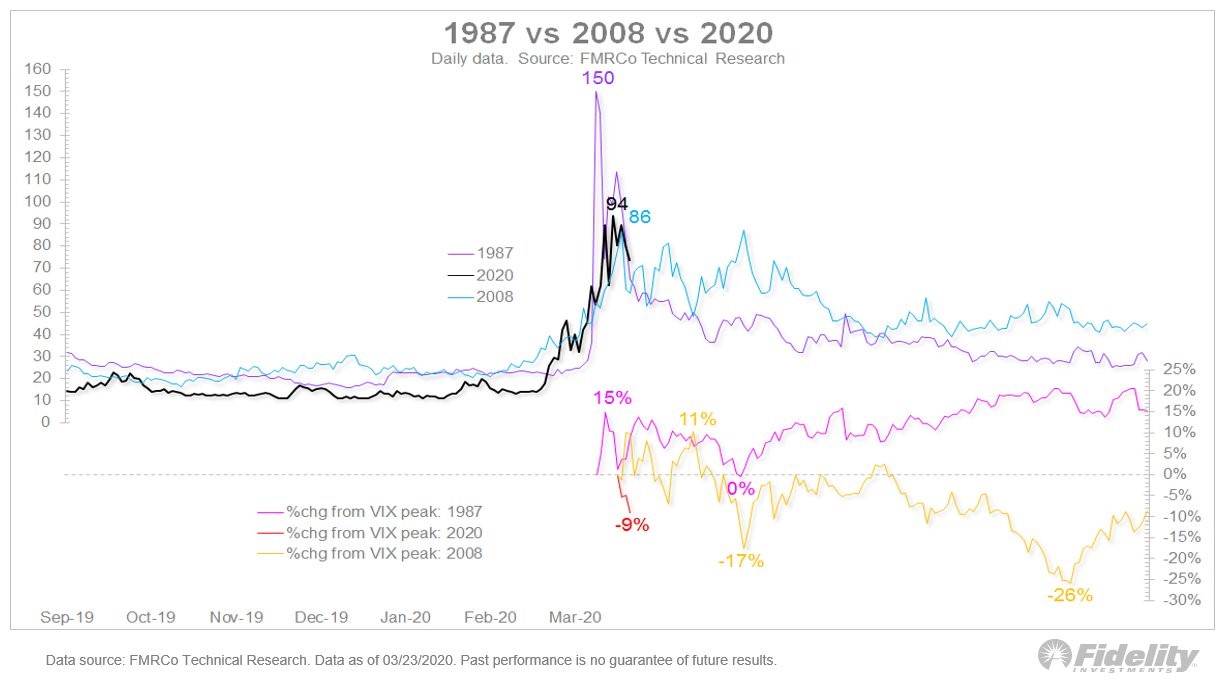
Volatility Peak
The chart below shows how volatility peaked just like it did in 2008 and 1987. In 2008, the VIX peaked 4 months before stocks troughed. There was an initial decline after that, a rebound, and then a final bottom which washed out everyone. In 1987, the volatility peak was perfectly in line with the bottom in stocks.

You can say the current market is similar to 1987. In 1987 portfolio insurance was common and now, we have ETFs and passive investing. However, that’s a faulty narrative thus far because passive investors haven’t sold. This decline has come from active fund managers.
Only 8% of Vanguard households made trades from February 19th to March 20th and half of them only made one trade (buying the dip). More than 90% of self-directed individual investors have not traded in response to the decline in stocks. If there was panic among passive investors, we’d see a major decline. Only weakness from passive investors is going to be from the decline in 401k contributions because of job losses. The government eliminated the fee to take up to $100,000 out of your 401k, so there might be some selling related to that as well.
There Is No Liquidity
We’re seeing a lot of volume in markets, but not a lot of liquidity. It has become insane. In 2013, it took $750 million to move the market. Now to move the market in the same manner, it takes just $1 million. The chart below shows the extreme low liquidity has fallen to.
It fell very low in the fall of 2018 as well. We will be watching liquidity in the next few days to see if the markets have gone back to normal. We’ve seen major companies trade like penny stocks. You can get any price you want if you are willing to be patient.

Review Of Friday’s Action
Nasdaq fell 3.79% and the Russell 2000 fell 4.09%. VIX was up 4.54 to 65.54. We expect the VIX to continue to fall in the next few weeks like was implied by the chart earlier. 10 year yield fell 17 basis points to 68 basis points. That flattened the curve since the short end is stuck near zero. Normally, 17 basis points would be a huge move, but this isn’t like what we saw in late February and early March.
If the 10 year yield gets towards 0%, it’s in recessionary territory. Since we are in a recession, it’s hard to see it getting and staying above 1%. Because of the decline in yields, the utilities sector was the only gainer as it was up 0.52%. Consumer staples only fell 0.72% as the flight to safety trade was in play. Energy was the biggest loser as it gave back some of its recent gains as it fell 6.93%.
COVID-19 Update
Friday was a good day in the battle versus COVID-19. Only bad news was the big spike in deaths in Italy. Number of new tests in America rose 107,172 to 626,667. The chart below shows the parts of America in the worst situation.
As you can see, many states are growing at a quicker rate than Italy was in early March. That’s terrible news because Italy is in bad shape. Hopefully, there are fewer deaths than in Italy.

New York City is one of the worst areas in America. As you can see from the chart below, the number of new cases on March 27th rose from 3,101 to 3,585. That’s still below the peak on March 25th.
Hopefully, it stays below that peak, but many don’t think it will. Several think it will peak in early April. According to the betting odds, there is a 74% chance the number of cases in America rises to over 1 million by April 15th. There are currently 104,256 cases in America which is the most by far. Italy is in 2nd at 86,498.
America didn’t have a bad day as the number of new cases only rose from 17,224 to 18,691. We expect it to keep rising, so a small increase is good. In Italy, the number of new cases fell from 6,203 to 5,909. This was the 4th most daily new cases. Terrible news is the number of daily deaths rose from 712 to 919 which is a new high (previous record was 793).

Recent Comments