Hey trader,
Yesterday’s ceasefire gap looked like a breakout.
The move above the 50-day and 200-day moving averages looked like confirmation of a bottom.
The historical record says it is an exhaustion signal.
If the data is right, folks are about to get caught leaning the wrong way.
Since 2003, SPY has gapped from below both the 50-day and 200-day moving averages to above both in a single session exactly three times.
Each instance was followed by a decline of 13% to 16% in the weeks that followed.
Yesterday was the fourth.
The Block Hunter Console has flagged bearish institutional prints across multiple names this week.
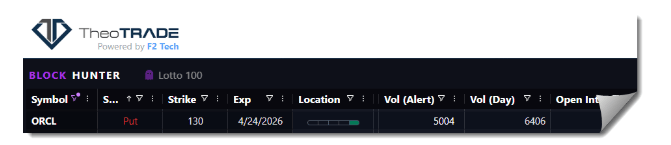
Today, one institution bought $1 million in Oracle puts in a single print at the ask.
The 50-day and 200-day moving averages are converging right now.
That convergence is what made the gap possible, and it signals a market where intermediate-term weakness is pressing against long-term support.
The SKEW index hit 150 yesterday. The dispersion index is climbing toward 38. Institutions used the ceasefire rally to reload protection at lower premiums.
The Oracle print gives you the specific level they are targeting for $2.20 of risk.
What the Data Shows
Since 2003, the S&P 500 has traded below both the 50-day and 200-day moving averages and then gapped above both in a single session only three times before yesterday.
- The first was in 2007. SPY declined 13% in the weeks that followed.
- The second was in 2015. The decline reached 16%.
- The third was in late 2018. SPY dropped 13% again.
The sample size is small. The consistency is what matters. Three instances over 23 years, all producing double-digit declines within weeks of the gap.
Why Convergence Creates the Setup
The gap above both averages only becomes possible when the 50-day and 200-day are close together. That convergence occurs when intermediate-term weakness pulls the 50-day down toward a flattening 200-day.
The 50-day is declining right now. The 200-day is beginning to flatten.
The distance between them narrowed enough for a single session to clear both. That compression is the symptom of a market already in transition.
In each prior instance, the market traded higher briefly before rolling over. The temporary bid from short covering and mechanical rebalancing exhausted itself, and the underlying weakness reasserted.
Where the Pressure Concentrates
The SKEW index closed at 150 yesterday. That reading reflects institutional demand for deep out-of-the-money S&P 500 puts at a level consistent with crash protection.
The S&P 500 Dispersion Index is approaching 38. Rising dispersion means the implied volatility on individual S&P 500 components is climbing relative to the VIX, and most of that component volatility is weighted toward the largest names in the index.
Mag Seven stocks are underperforming the S&P 500 right now. The companies with the largest index weighting are lagging the very rally they should be leading.
The last time DSPX reached similar levels was early April 2025. Dispersion spiked to 50 over the following two weeks, and a significant sell-off followed.
When that kind of correction arrives, the damage concentrates in large-cap names already showing relative weakness. Stocks trading below resistance with declining momentum absorb the selling first.
Why Oracle Fits the Profile
Oracle has been trading below its point of control near $150 for weeks. The stock is sitting near support at $136 with lower highs on the daily chart.
A stock in that position is already vulnerable. A broad market decline of the magnitude the exhaustion gap pattern suggests would pressure it further.
The Block Hunter Console flagged 5,000 put contracts bought on Oracle at the $130 strike for April 24 expiration. Fill location confirmed the trade at the ask. The notional value exceeded $1 million in a single print.
An institution looked at the same macro setup and chose Oracle as the vehicle. The $130 target sits below support, and if the stock breaks $136, the gamma exposure from those 5,000 contracts forces dealer hedging that accelerates the move lower.
How to Structure the Trade
A put vertical on Oracle captures the downside thesis with defined risk. The stock does not need to reach the institutional target at $130 for the spread to produce a return.
- Buy the ORCL May 15 $140 put
- Sell the ORCL May 15 $135 put
- Spread width: $5
- Cost: Approximately $2.20
- Breakeven: $137.80
- Max risk: $2.20 (the debit paid at entry)
- Target: 30% to 50% return on the spread
- Direction: Bearish
- Catalyst: Exhaustion gap signal, converging 50/200-day moving averages, SKEW at 150, rising dispersion, $1 million institutional put print at $130
A move to $135 puts the lower strike at the money and accelerates the value of the spread as expiration approaches. Any pullback toward recent support does the work.
The 5,000 contracts at $130 create a secondary catalyst.
If Oracle breaks support and approaches that level, dealer hedging on those puts shifts from minimal to substantial, compounding the selling pressure.
What the Console Is Tracking Now
The Block Hunter Console flagged the Oracle print and confirmed through fill location that the puts were bought at the ask.
The bearish tenor across the Console this week aligns with every structural signal the data is producing.
The exhaustion gap that SPY triggered yesterday has preceded a double-digit decline in every prior instance since 2003.
The SKEW index, the dispersion index, and Mag Seven underperformance all point in the same direction.
The Oracle print tells you where one institution expects that pressure to land.
The spread gives you the structure to position alongside that conviction for $2.20 of risk.
See exactly how Block Hunter catches institutional positioning before the crowd catches on.
Brandon Chapman, CMT
Creator of Ghost Prints