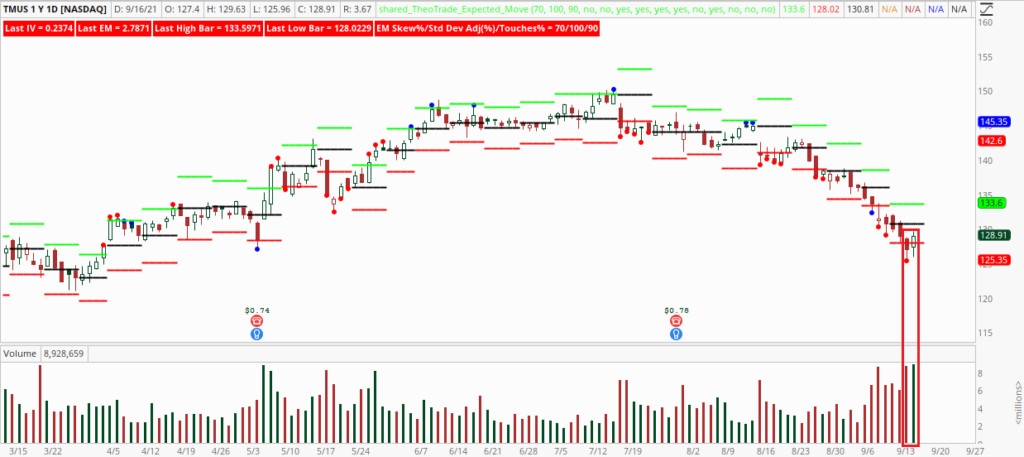
After a nice bullish trend in the spring, T-Mobile US Inc (NASDAQ: TMUS) has been wilting in the summer heat. The share price has especially seen it’s price fall on high volume over the past six days. However, that trend broke today.
Today’s rather underwhelming move may not create a lot of confidence to go long, but this is where considering the option activity may be helpful.
TMUS Option Activity
Today’s call activity was significant. The call volume was sizzling at six times the average with a put-to-call ratio of 0.169. The lopsided activity doesn’t necessarily mean bullish as there have been a lot of short calls rolled this week. That’s where looking at the composition of the activity is important. Today, 43% of the call volume was filled at the ask and 12% at the bid. The bias was definitely call option buying, but you’ll need to go a little deeper.
Here’s a breakdown of today’s significant activity:
- 8,700 24 SEP 21 $129 calls mostly BOT @ $0.69 to $0.90
In order to determine whether the calls bought were open or closed, you need to look at open interest. In this case, the open interest was a mere 169 contracts. This indication lets us know that the volume is mostly opening, bullish activity.
TMUS Technicals
If you look at the price chart, nothing really stands out other than the stock closed 1.45% higher, only pennies above the previous day’s high. Using Don Kaufman’s Expected Move indicator, you would have considered taking a bullish trade yesterday since it closed for the second week below the lower end of the range.

For some, that doesn’t make it easy. Many will wait until the price moves substantially higher, waiting for a breakout. Besides the option activity, the volume stands out as an indication that buyers came in the stock today. That being said, the technical analysis provides an early indication of support.
Conclusion
The combination of fundamental and technical strength is an important setup. However, the option activity helps provide a key indication of interest and potential for volatility. The term ‘gamma’ has become a regular part of trading vernacular and it’s this type of interest that helps generate the movement in the underlying. While there are no guarantees in trading, there are indications and this has a few going for it.
Wondering when to hedge? See how unlocking the Vomma Zone can help you better understand when volatility is about to rise.
Want learn more about how to work with me? Check out Trader by Your Side!
Not a subscriber? Become a TheoTrade member
Recent Comments