
Hey trader,
Trailing a stop off an indicator feels precise. You read the number and move your stop to it.
Sometimes that number is a price the market can’t trade.
Parabolic SAR is an indicator that prints a dot above or below each candle, and it’s my go-to for setting stops.
On a short, you slide your stop down those dots as price falls.
On Monday, the dot from the Parabolic SAR on my MES short read 7771.43…except that’s not a price I can use.
You see, the MES micro S&P 500 futures contract trades in 0.25 increments.
No problem, just round up or down, right?
Here’s the thing – the wrong choice can leave you with a tight stop that can knock you out of a winner on one small wiggle.
That’s an expensive way to lose a good trade.
Yet, you don’t want to give up any more money than you should.
So, what’s the solution?
I run two quick checks before any trailed stop goes in. They take seconds and work on any market and you can use them immediately.
Here’s how both checks work, using that short from entry to target.
Why I Trail Off The Dot
A trailing stop follows the trade. As price moves your way, the stop locks in more of the gain.
Now, there is plenty of data that suggests trailing stops are a bad idea. However, most of those studies look at static trailing stops like $0.25 or 1%.
I trail off the Parabolic SAR on Bollinger Band trades.
Those setups fire on a close outside the band, and they live on momentum.
Notice I said “CLOSE”…we’ll get to that in a moment.
While the breakout keeps pushing, the dots follow right behind it. Each one hands me a fresh level for the stop.
That level still needs two checks before it becomes a real order.
Step One: Only A Closed Candle Counts
The dot on a live candle isn’t finished. It keeps recalculating until that candle closes.
Move your stop to that dot, and you’re chasing a number that can still shift. Your stop ends up at a level the indicator never settled on.
With the number of tweets moving the markets these days, that can be a world of difference.
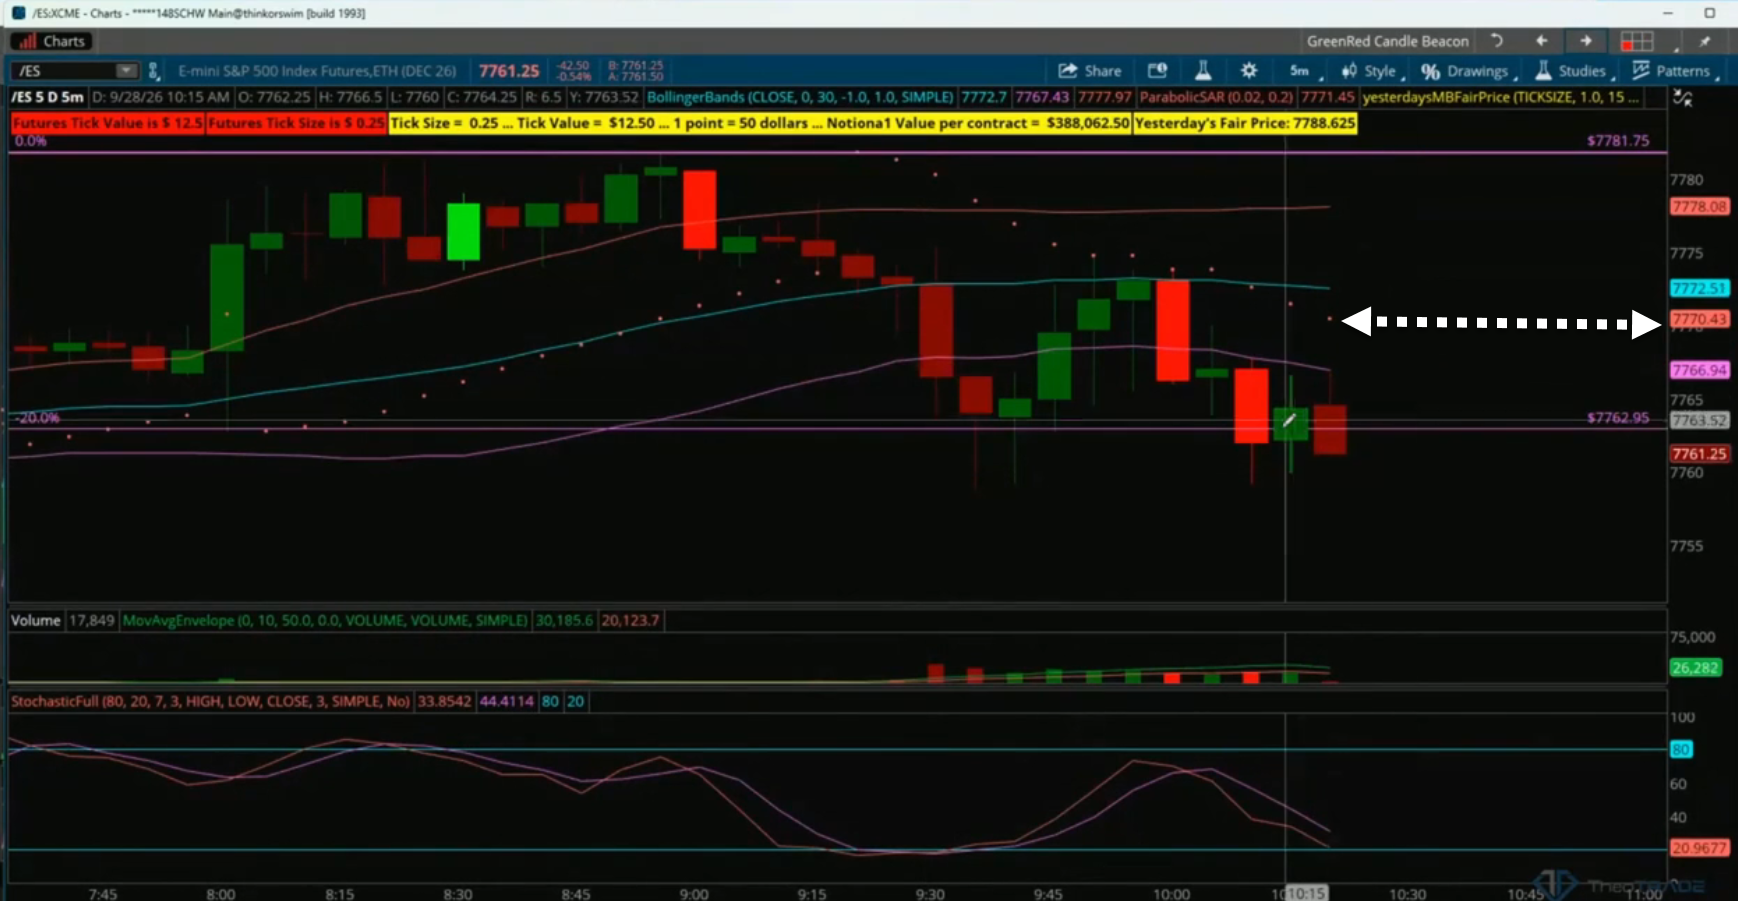
On Monday, I pointed the room to two dots on the MES chart. The one on the open candle didn’t count yet.
A dot only counts once its candle has closed.
The closed candle’s dot is the one I trail from. You’ll find its reading in the study header at the top of the chart.
That header read 7771.43.
Step Two: Round Away From Price, Then Add A Tick
The ES and MES trade in ticks of 0.25. Near that reading, the real prices were 7771.25, 7771.50, and 7771.75.
The 7771.43 reading fell between two of them. No tick exists there, so it isn’t a real number.
On a short, the stop sits above price. Rounding up to 7771.50 keeps it at or beyond the dot, not inside it.
Then I add one full tick for the spread. The spread is the gap between what buyers bid and what sellers ask.
That extra tick gives the stop a little breathing room. Mine landed at 7771.75.
Round away from price, then give the stop one more tick.
On a long, everything flips. The stop sits below price, so you round down and subtract a tick.
The whole check runs in seconds on your own chart:
- Pull the reading from the last closed candle, never the one still forming.
- Round that reading away from price to the next real tick.
- Add one full tick past that for the spread, then place the stop.
Monday’s Short From Entry To Target
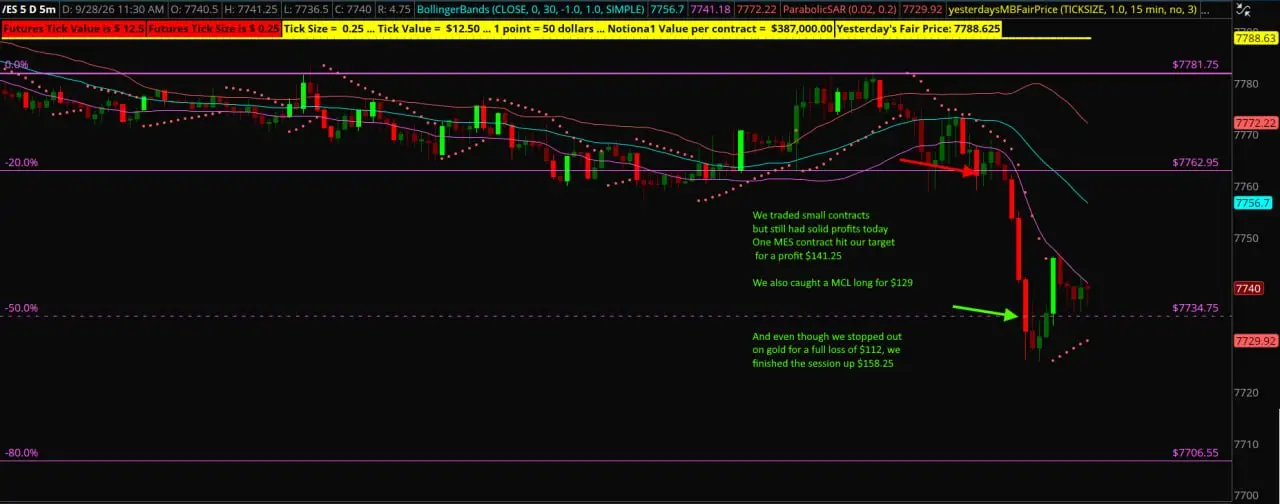
Price closed below 7762, and I called the short at 7763. I rested a sell limit instead of chasing, and it filled right at my price.
My first stop sat at 7781.75, roughly $93 of risk on one micro. The target was 7734.75, about 28 points below my entry.
The first adjustment came from price action. A one-count reversal with follow-through let me pull the stop to 7774.
Once the breakout started carrying the trade, the closed-candle dot took over. Both checks moved the stop to 7771.75.
I sized the trade off the original stop at 7781.75.
A member asked about sizing larger off the adjusted stop. I told him he could.
I always go off the initial stop. That’s my line, and it doesn’t have to be yours.
The MES reached 7734.75 for a gain of 28.25 points. On one micro, that paid $141.25.
The other two trades split.
Crude ran from 94 to its 95.29 target for $129. Gold stopped me out for the full $112.
Two winners and one loss left the session up $158.25.
Volatility spiked after bonds broke support, so I stepped back. I waited more than 30 minutes for a strong setup, then called it a day.
Inside the 10% Club, every trade comes with an entry, a stop, and a target. You’ll hear each stop adjustment as I make it, down to the tick.
Those adjustments go into the chat and announcements. You can keep up even after I move over to the futures room.
Trail from a closed candle, then round your stop one tick past the dot.
Blake Young
Senior Market Strategist, TheoTRADE